The 5 Studies
Detailed descriptions of each of the 5 studies comprising the Common Cold Project can be obtained by following the relevant link in the left navigation column. Here we provide a brief overview of the studies and how they compare in terms of research aims, study design, and sample characteristics.
Primary Study Aims
Each of the 5 studies comprising the Common Cold Project was designed to address a specific set of hypotheses, though all assessed an extensive array of biological, psychological, and behavioral variables. See Measures by Study for a full list of measures collected in each study.
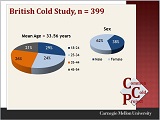
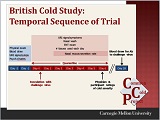
The British Cold Study (BCS) primarily focused on psychological stress—operationalized both in terms of objective stressful life events and individuals’ subjective ratings of the perceived stressfulness of their lives—and its association with common cold susceptibility. |
|
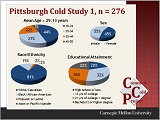
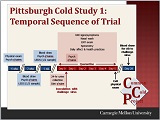
PCS1 replicated and extended the BCS’ examination of psychological stress and common cold susceptibility by including an intensive interview measure of major life stressors—the Life Events and Difficulties Schedule (LEDS). PCS1 also expanded the selection of biological measures by including assessment of stress hormones and functional immunity. |
|
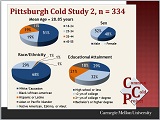
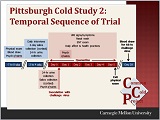
| In addition to examining the role of psychological stress in common cold susceptibility, PCS2 also investigated the roles played by social relationships, childhood socioeconomic status (SES), and personality (Big 5). PCS2 further elaborated on the previous 2 studies by including interview assessments of daily social interactions and mood that were conducted by telephone for 3 nights a week over a period of two weeks. In addition to the urine stress hormone measures collected in PCS1, PCS2 also included three days of saliva sampling for assessment of diurnal cortisol. | |
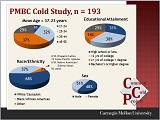
| As part of the broader Mind-Body Center Project, a major focus of PMBC was identifying biological mechanisms that link psychosocial factors with susceptibility to the common cold. Accordingly, PMBC assessed numerous psychological and behavioral variables, including personal attributes, social factors—with special emphasis on the marital relationship, socioeconomic status, and health practices, as well as multiple biological factors. PMBC also included detailed daily interviews with participants over 14 consecutive days to assess social interactions, mood, and health behaviors. | |
|
|
PCS3 extended work on the role of childhood environment in common cold susceptibility by including additional retrospective measures of childhood and adolescent experience, such as family structure and relationships, neighborhood physical and social environments, and childhood physical health. Numerous other social, psychological and behavioral measures were administered as well, including the 14-day interview protocol that was conducted in PMBC. One of the novel features of PCS3 is that it introduced several additional biological assessments and a two laboratory stress-reactivity sessions. |
Study Designs
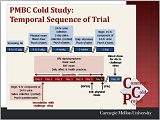
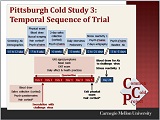
Whereas the BCS began data collection upon participant arrival at the Common Cold Unit, the four Pittsburgh studies (i.e., PCS1, PCS2, PMBC, PCS3) included extended pre-quarantine data collection periods of varying lengths. Data collected during this time included psychological measures, urinary catecholamines (PCS2, PMBC), saliva cortisol (PCS2, PMBC, PCS3), daily interviews (PCS2, PMBC, PCS3), and laboratory stress reactivity (PCS3). Blood draws also were performed for complete blood counts and serum chemistries, as well as for assessment of cortisol (PCS1), cytokines (PMBC), and telomere length (PCS3). PCS3 also included a post-challenge laboratory stress reactivity session. Procedures conducted while participants were in quarantine were largely identical across studies. Exceptions are as follows: 24-hour urines (for measurement of catecholamines) were collected during the first day of quarantine in all studies but PCS3; saliva (for measurement of cortisol) was collected at multiple time-points throughout the first day in quarantine in all studies but PCS1; and a single urine sample (for measurement of F2-isoprostanes) was collected on participants’ first morning in quarantine in PCS3. Additional design features are presented in Table 1.
Table 1. Design features of each of the 5 studies comprising the Common Cold Project
| BCS | PCS1 | PCS2 | PMBC | PCS3 | |
| Years data colected | 1986-1989 | 1993-1996 | 1997-2001 | 2000-2004 | 2007-2011 |
| Timing of pre-quarantine data collections | n/a |
2 weeks pre; 1 week pre |
7-8 weeks pre; 2-4 week pre |
4-6 weeks pre; 3 weeks pre |
7-8 weeks pre; 6 weeks pre; 5 weeks pre; 3 weeks pre; 3-5 days pre |
| Days in quarantine | 6 | 5 | 5 |
5 (RV39) or 6 (flu) |
5 |
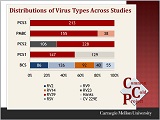
| Virus(es) |
RV2 (n=86) RV9 (n=126)RV14 (n=92) RSV (n=40) CV 229E (n=55) |
RV39(n=147) Hanks (n=129) |
RV39 (n=228) RV23 (n=106) |
RV39 (n=155) Influenza A (n=38) |
RV39 (n=213) |
| Maximum screening Ab titer | none | none | none | 4 | 4 |
RV = Rhinovirus. RSV = Respiratory Syncytial Virus. CV = Coronavirus.
Design Slides Available for Download
|
|
|
|
|
|
|
|
Study Samples
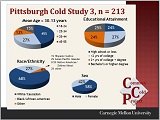
Table 2 presents description information about the sample populations employed in each of the 5 studies. With the exception of age, participants were not selected or excluded based on any demographic characteristic.
Table 2. Sample demographic characteristics
| BCS | PCS1 | PCS2 | PMBC | PCS3 | |
| Sample size | 399 | 276 | 334 | 193 | 213 |
| Age range (years) | 18-54 | 18-55 | 18-54 | 21-55 | 18-55 |
| % Female | 62% | 55% | 52% | 51% | 42% |
|
Race/Ethnicity White/Caucasian Black/African-American Other† |
Data not collected |
81% 15% 4% |
68% 30% 2% |
56% 37% 7% |
67% 27% 6% |
|
Education High school or less <2 years of college >2 years of college + degree Bachelor's or higher degree |
Although BCS education data are available, British levels do not conform to standard U.S. categorization. | 20% 32% 26% 22% |
29% 32% 21% 18% |
31% 30% 14% 25% |
24% 27% 24% 25% |
| Currently employed | 63% | 62% | 57% | 56% | 60% |
|
Marital Status Married/marital-like Never married Separated Divorced Widowed |
40% 40% 3% 16% 1% |
27% 51% 5% 16% <1% |
25% 57% 5% 13% <1% |
35% 42% 7% 14% 2% |
15% 73% 5% 7% <1% |
†Additional race/ethnicity categories include Hispanic or Latino; Asian or Pacific Islander; Native American, Eskimo, or Aleut; and Other (e.g., mixed race)
Sample Description Slides Available for Download
|
|
|
|
|
|
|