Trait Affect (PCS1, PCS2, PMBC, PCS3)
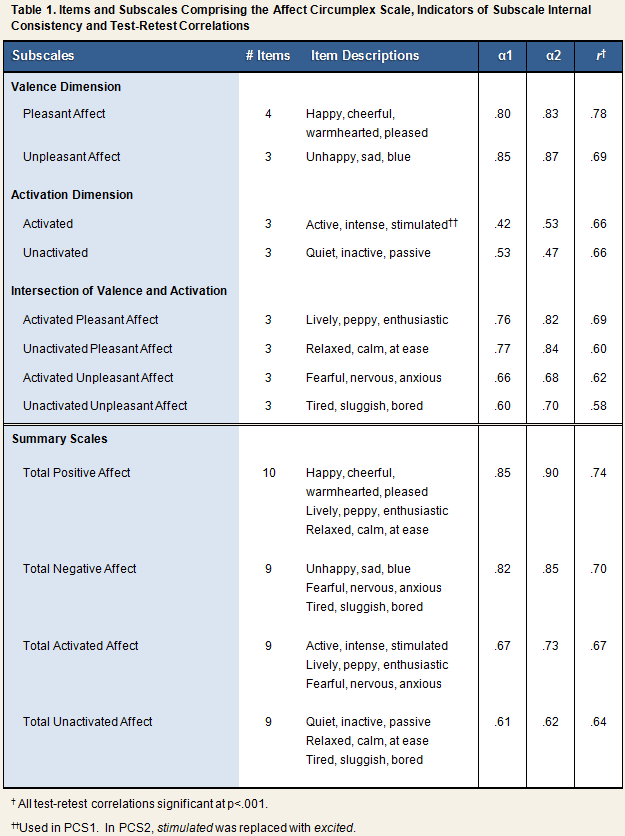
TitleTrait Adjective Questionnaire – Affect Circumplex Scale (Based on the Larsen & Diener Circumplex Model) StudiesPCS1, PCS2 Copyright InformationNot a copyrighted scale Primary ReferenceLarsen, R. J., & Diener, E. (1992). Promises and problems with the circumplex model of emotions. In: Clark, M. S. (Ed.), Emotion. Newbury Park, CA: Sage Publications. PurposeTo evaluate two orthogonal dimensions of trait affect: valence and activation. Type of MeasureCreated. The theoretical basis of the measure was derived from Larsen & Diener’s (1992) Circumplex Model of emotion. DescriptionParticipants are presented with a list of adjectives and asked to indicate, using a 5-point response scale, how accurately each adjective describes how they typically or generally are, as compared with other persons that they know of the same sex and age. AdministrationPCS1In PCS1, the 25 items comprising the Affect Circumplex Scale were included as a part of the larger Trait Adjective Questionnaire (TAQ), which was administered during the pre-challenge baseline period on 2 occasions separated by one week (see PCS1 Trial Outline). In addition to assessing trait positive and negative mood, the 88-item TAQ includes items that measure characteristic levels of activity and passivity and dimensions of personality. PCS2In PCS2, the Affect Circumplex Scale was administered on two occasions, separated by approximately 8 weeks, during the pre-challenge baseline period (see PCS2 Trial Outline). On both occasions, Affect Circumplex items were included as a part of a 61-item version of the TAQ. Scaling
|
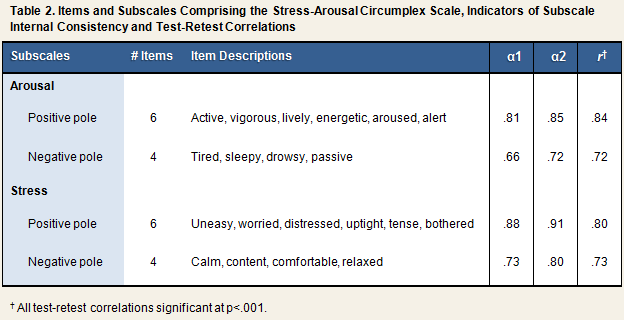
TitleTrait Adjective Questionnaire – Stress-Arousal Circumplex Scale (Based on the Mackay Circumplex Model) StudyPCS1 Copyright InformationNot a copyrighted scale Primary ReferenceMackay, C., Cox, T., Burrows, G., & Lazzerini, T. (1978). An inventory for the measurement of self-reported stress and arousal. British Journal of Social and Clinical Psychology, 17, 283-284. PurposeTo evaluate two orthogonal dimensions of trait affect: stress and arousal. Type of MeasureCreated. The theoretical basis of the measure was derived from Mackay et al.’s (1978) Stress Arousal Checklist (SACL; Mackay et al., 1978). DescriptionParticipants are presented with a list of adjectives and asked to indicate, using a 5-point response scale, how accurately each adjective describes how they typically or generally are, as compared with other persons that they know of the same sex and age. AdministrationThe 20 items comprising the Stress-Arousal Circumplex Scale were included as a part of the larger Trait Adjective Questionnaire (TAQ), which was administered on 2 occasions during the pre-challenge baseline period, separated by one week (see PCS1 Trial Outline). Scaling0 = Not at all accurate, 1 = A little accurate, 2 = Moderately accurate, 3 = Quite a bit accurate, 4 = Extremely accurate Number of Items20 Scoring/VariablesSubscale scores were computed by summing the response values of the component items, which are displayed in Table 1. The table also contains indicators of internal consistency (Cronbach’s α) and one-week test-retest reliability (Pearson’s r for correlation between scores obtained from the first and second administrations of the scale) computed for the PCS1 sample (n=276). The dataset includes items and scales computed for each administration, as well as scale scores averaged across the two administrations.
|
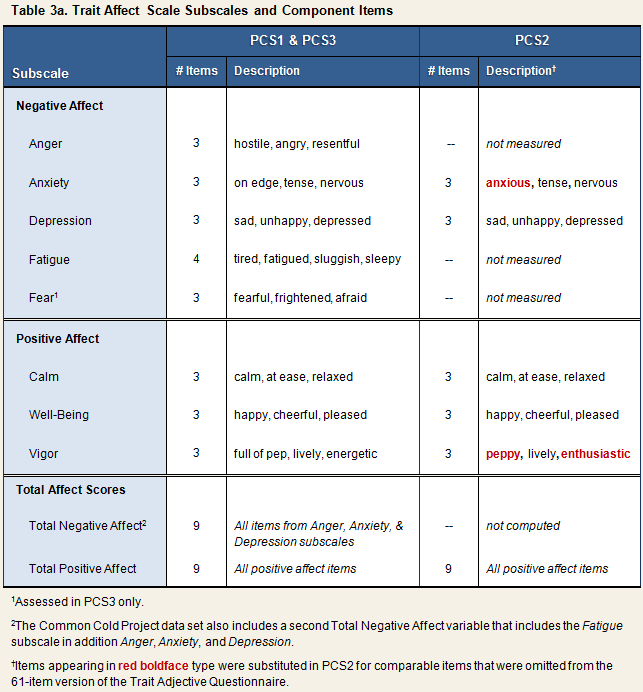
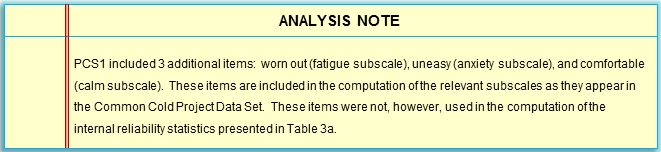
TitleTrait Adjective Questionnaire – Trait Affect Scale (25-item [PCS3]; 22-item [PCS1]; 15-item [PCS2]) StudiesPCS1, PCS2, PCS3 Copyright InformationNot a copyrighted scale Primary ReferencesUsala, P. D., & Hertzog, C. (1989). Measurement of affective states in adults. Evaluation of an adjective rating scale instrument. Research on Aging, 11, 403-426. PurposeTo assess trait or characteristic levels of positive and negative affect. Type of MeasureCreated. The full 25-item Trait Affect Scale was created based on Usala & Hertzog’s (1989) factor analysis of 65 mood adjectives. The scale can be broken down into three 3-item positive affect subscales; three 3-item negative affect subscales; one 4-item fatigue subscale; and one 3-item fear subscale. Whereas the scale administered in PCS3 included all 8 subscales, the 22-item version that was administered in PCS1 did not include the fear subscale, and a 15-item version of the scale that was administered in PCS2 included only the 3 positive affect subscales and 2 of the 3 negative affect subscales. DescriptionUsing a 5-point scale, participants rated the accuracy with which each of several mood-related adjectives describes how they generally or typically feel. AdministrationPCS1In PCS1, the 22-items comprising the positive and negative affect components of the scale were included as a part of the larger Trait Adjective Questionnaire (TAQ), which was administered during the pre-challenge baseline period, on 2 occasions separated by one week (see PCS1 Trial Outline). In addition to assessing trait positive and negative mood, the 88-item TAQ includes items that measure characteristic levels of activity and passivity and of indicators of various dimensions of personality. PCS2In PCS2, the 3 positive affect subscales and 2 of the negative affect subscales (anxiety and depression) of the Trait Affect Scale were administered on 2 occasions during the pre-challenge baseline period, with the first and second administrations being separated approximately 8 weeks (see PCS2 Trial Outline). On both occasions, Trait Affect Scale items were included as a part of a 61-item version of the TAQ. PCS3In PCS3, the Trait Affect Scale was presented as a unique 25-item questionnaire that was administered on 2 occasions during the baseline period, separated by approximately six weeks (see PCS3 Trial Outline). ScalingPCS1 & PCS3: 0 = Not at all accurate, 1 = A little accurate, 2 = Moderately accurate, 3 = Quite a bit accurate, 4 = Extremely accurate Number of ItemsPCS1: 22 Scoring/VariablesSubscale scores were computed by summing the response values of the component items (see Table 3a). Total Positive and Negative Affect scale scores were computed by summing their component subscales.
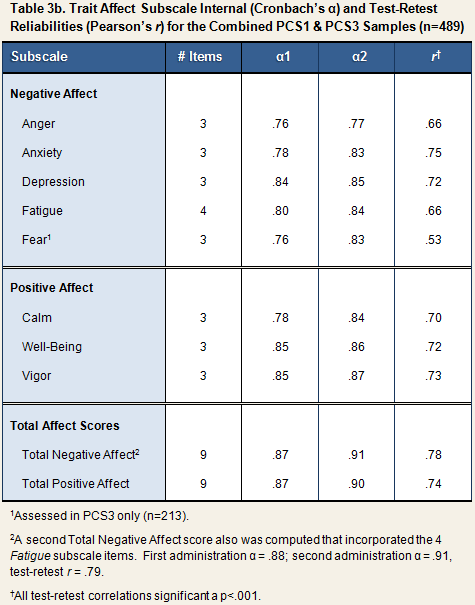
Table 3b contains indicators of internal consistency (Cronbach’s α) and test-retest reliability (Pearson’s r for correlation between scores obtained from the first and second administrations of the scale) computed for the combined PCS1 and PCS3 samples (n=489). The dataset includes items and scales computed for each administration, as well as scale scores averaged across the two administrations.
|
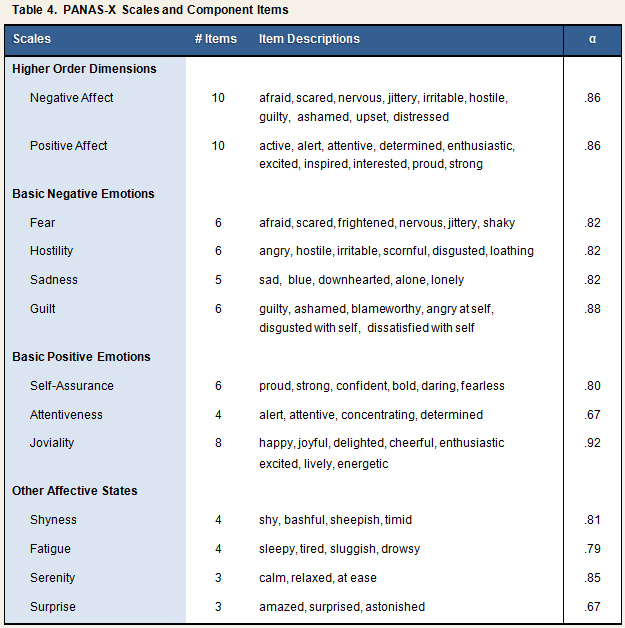
TitlePositive and Negative Affect Schedule (PANAS-X) StudyPCS3 Copyright InformationCopyright is held by the American Psychological Association (APA); click to access permissions page Primary ReferencesWatson, D., Clark, L. E., & Tellegen, A. (1988). Development and validation of brief measures of positive and negative affect: The PANAS scales. Journal of Personality and Social Psychology, 54, 1063-1070. PurposeTo assess levels of positive & negative affect. DescriptionParticipants use a 5-point response scale to indicate the extent to which each of 60 mood-related adjectives describes how they generally or typically feel. AdministrationIn PCS3, the first 30 items of the PANAS were administered 3-5 days prior to Quarantine, and the remaining 30 items on Quarantine Day 0. Scaling1 = Very slightly or not at all, 2 = A little, 3 = Moderately, 4 = Quite a bit, 5 = Extremely Number of Items60 Scoring/VariablesSubscale scores were computed by summing the response values of the component items (see Table 5). Data on the validity of the PANAS for assessing trait affect, test-retest stability of the scale, and internal consistency reliabilities of the subscales have been published by Watson and Clark (1994). Subscale internal consistencies (Cronbach’s α) for the PCS3 sample (n=213) are reported in the last column of Table 4.
|