COVID-19’s effect on Criminal Activities in the United States
By Yuang Li
Introduction
Did the Coronavirus pandemic lead to an increase in criminal activity? The answer should be of interest to policy makers to learn whether similar criminal activity would be expected to surge or decline during another public health crisis.
If surges in criminal activity do occur, policy makers and public officials could potentially allocate more resources so the anticipated need for judicial and law enforcement resources could be sufficiently addressed. In criminal cases, having better anticipation of the health crisis’ impact on societal criminal activity could potentially minimize casualties and save lives.
Analysis
In criminal studies, the Routine Activities of Crime Theory serves as a framework for many scholars in studying crime during times of chaos and uncertainty. According to the theory, a crime occurs where a motivated offender has come across a target where the safety of the target and barrier to criminal activity isn’t posed by any figure of security.
The initial stages of the pandemic resulted in lockdowns and “shelter-in-place” orders pushed by state and local governments in many parts of the United States. Such pandemic response policy might have two effects with respect to criminal activities, as assumed by the Routine Activities of Crime Theory:
- A motivated violent crime offender -- as measured in terms of murder, rape, robbery, and aggravated assault -- is less likely to come across potential targets as both the motivated offender himself and potential targets may be separated by shelter-in-place orders. Thus, violent crimes are expected to decreases in the initial stages of the pandemic.
- A motivated offender committing property crimes -- as measured by burglary, larceny, theft, motor vehicle theft, and arson -- may more easily engage in property crimes when the figures of security are not present to guard such properties. Thus, property crimes are expected to increase in the initial stages of the pandemic.
- At later stages of the pandemic, violent crimes are expected to increase as potential targets and motivated offenders are no longer separated by shelter-in-place orders.
- Property crimes are expected to decrease as figures of security return to being present at their related properties. Examples of figures of security include business owners and private security hired for protecting businesses. This research does not differentiate the different types of properties that have been breached or violated.
These hypotheses will be tested on two separate bases:
- Test1 (H1) hypothesizes that the significant effects between Covid-19 cases and violent crimes will be positive between March-June 2020; Covid-19 cases and property crimes is expected to be negative and significant between March-June 2020.
- This research also includes a placebo test -- Test 2 (H2) – hypothesizing that these relationships are not present from July-December 2020.
Test 1:
H1: From March-June 2020, Covid-19 cases are expected to have a negative, significant relationship to violent crimes.
H1: From March-June 2020, Covid-19 cases are expected to have a positive, significant relationship to property crimes.
Test 2:
H2: From July-December 2020, Covid-19 cases are not expected to have a negative, significant relationship to violent crimes.
H2: From July-December 2020, Covid-19 cases are not expected to have a positive, significant relationship to property crimes.
Variables
In investigating hypotheses H1 and H2, reported crime rates will serve as the dependent variable, while the number Covid-19 cases will serve as the independent variable. Due to the unavailability of all 50 states’ crime data on the state level at the time of this research, reported crime data will be drawn from state-wide data from each individual state. Those states with most accessible classification on types of crime and number of occurrences by month are included; the datasets included have monthly records on all eight types of index crimes, which consist of four types of violent crime and four types of property crimes. The states included are Alaska, Arizona, Idaho, Massachusetts, Michigan, Nevada, Oklahoma, Oregon, Pennsylvania, Utah, and Virginia. The omission of certain states may result in sampling bias, as those states that are more resourced may be more likely to provide detailed crime data.
The data on Covid-19 cases, the independent variable, will be drawn from Johns Hopkins University’s Coronavirus Tracker; the source provides detailed, monthly data on Covid-19 cases from December 2019- July 2022 across all 50 states.
Results
Test 1
In the analysis of the first hypothesis, Covid-19 cases and corresponding crime data (property and violent) are adjusted to per capita value; this transformation is intended to better measure the relationship between the independent and dependent variables as the regions with larger population may see higher occurrences of both Covid-19 cases and reported crime.
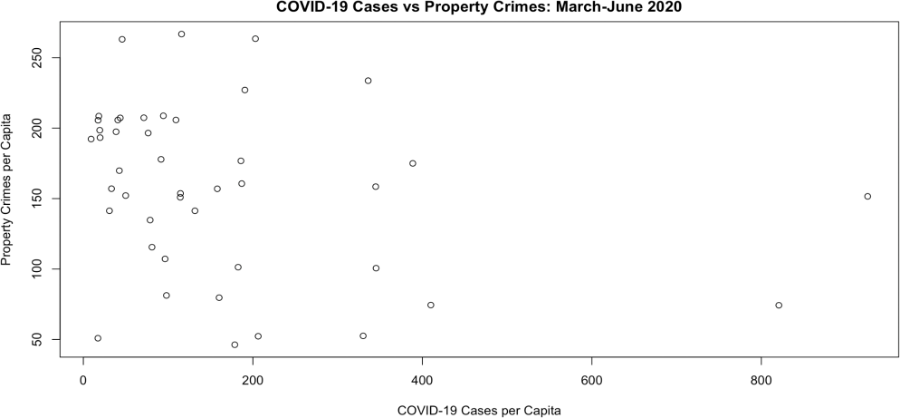
Figure 1: Scatter Plot of Covid-19 cases (per capita) vs property crime (per capita)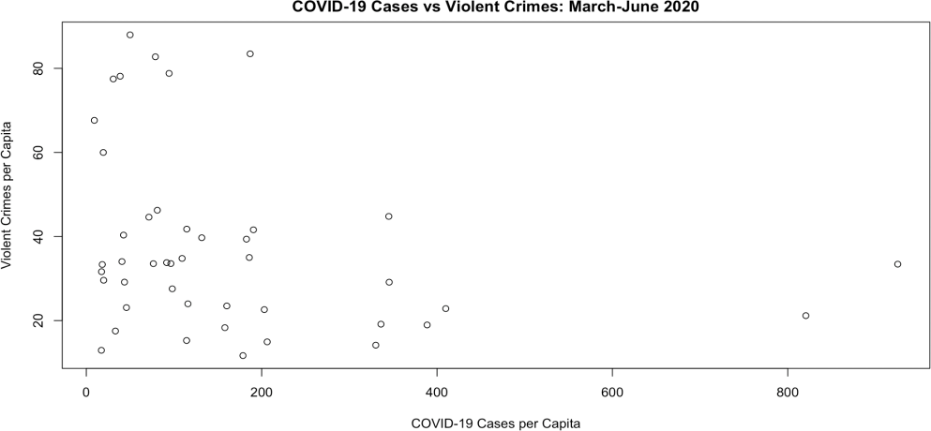
Figure 2: Scatter Plot on Covid-19 cases (per capita) vs violent crimes (per capita)
In Figure 1, the scatter plot of Covid-19 cases and property crimes shows a weak negative relationship. The trend observed in the data is contrary to the initial hypothesis, that there was a positive relationship between Covid-19 cases and property crimes.
In terms of Covid-19 cases and violent crime, there is a weak negative relationship given the distribution of the data. This trend is consistent with the initial hypothesis, that a negative relationship would exist between violent crimes and Covid-19 cases, as shelter-in-place orders would hinder the potential encounters between motivated offenders and potential targets.
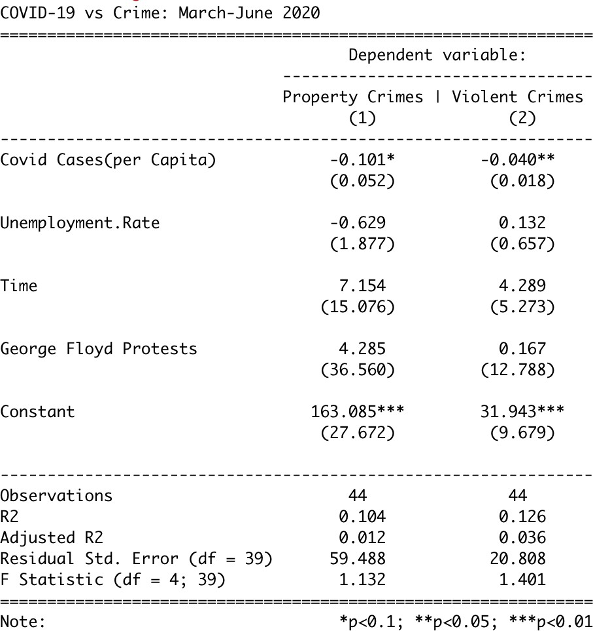
Figure 3: Regression summary of Covid-19 cases (per capita) and violent and property crimes (per capita)
Control variables are added. Control variables include:
- Unemployment rate. The variable is added to address the confounding effect between crime and Covid-19 cases, as regions with high unemployment typically observe more social unrest and criminal activity. The unemployment data of each state between March-June 2020, is drawn from the Federal Reserve Bank, which was then converted to the time-series-cross-sectional format. Each unique temporal and spatial combination between March and June 2020 is assigned its corresponding unemployment rate.
- George Floyd Protests. The death of George Floyd in Minneapolis caused a rash of protests across the United States. During protests, damage to property and persons may have occurred. To address the confounding relationship between Covid-19 cases and crime at the time, a fixed-effect method is used: the months of April-June 2020 are given the value 1, while other monthly units are given a value of 0.
- Time. The control variable seeks to address the simultaneity concern that may be occurring between the independent and dependent variables. Since the regression test takes the form of a time-series-cross-sectional structure, the month of March in each state investigated has an assigned value of 1 in the Time variable, with the month of April assigned the value of 2, etc.
In the regression outputs, Covid-19 cases have shown to have negative and significant relationship with violent and property crimes. The finding is consistent with the part of hypothesis that predicted negative and significant relationships would be present between Covid-19 cases and violent crimes.
However, the finding on Covid-19 cases and property crimes is inconsistent with the initial hypothesis; a negative and significant relationship is observed instead.
Test 2
This test seeks to determine whether the relationship observed in Test 1 is, in fact, caused by the Routine Activities of Crime. Test 2, as shown by H2, serves as the placebo test. A regression test will be conducted for H2.
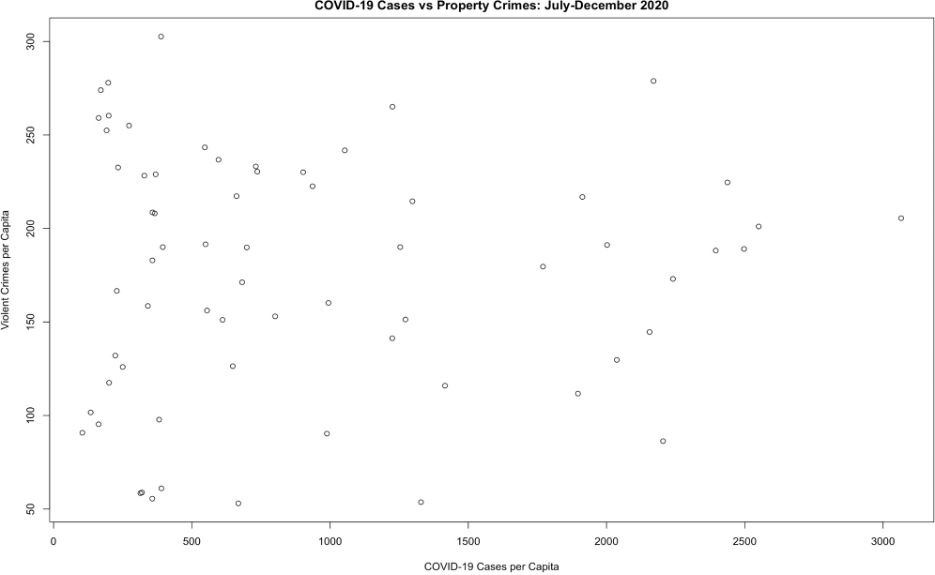
Figure 4: Scatter plot of Covid-19 cases (per capita) vs property crimes (per capita); July-December 2020
From the scatter plot of Covid-19 cases vs property crimes between July-December across 11 States, a weak positive relationship could be observed. If a non-significant, non-negative, or non-significant and non-negative relationship is observed in the regression test, the placebo test proves that the Routines Activities Theory of Crime, in fact, deters property crimes.
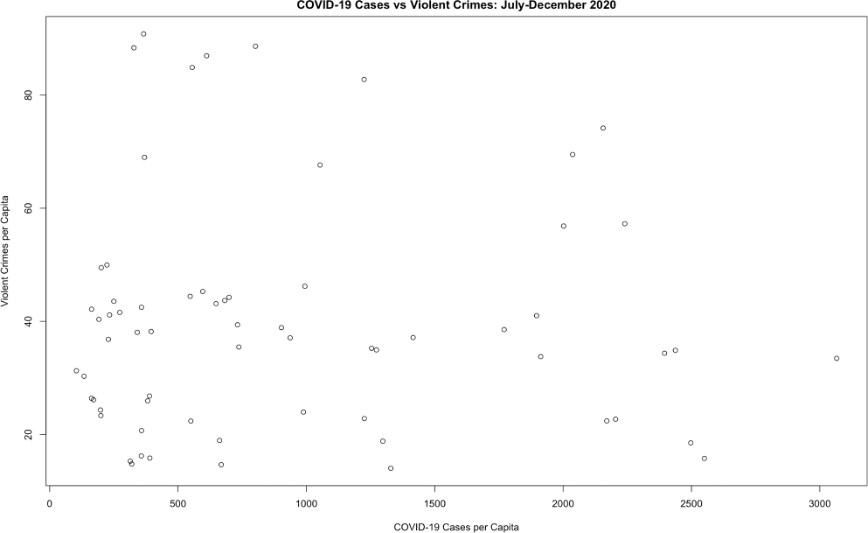
Figure 5: Scatter plot of Covid-19 cases (per capita) vs violent crimes (per capita); July-December 2020
From the scatter plot of Covid-19 cases vs property crimes between July and December 2020 across the 11 States, a weak positive relationship is observed. If a non-significant, non-negative, or non-significant and non-negative relationship is observed in the following regression test, the placebo test proves that the Routines Activities Theory of Crime, in fact, deters property crime.
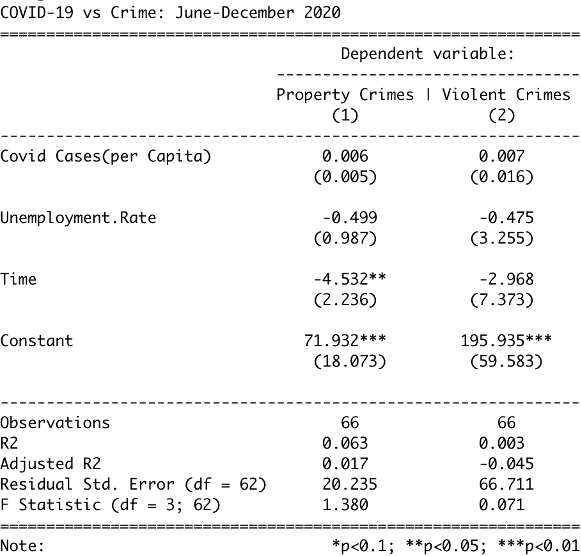
Figure 6: Placebo test — Covid-19 cases (per capita) vs violent and property crimes (per capita)
In the two models of the placebo test, control variables were added. Control variables include:
- Unemployment Rate. The variable is added to address the confounding effect between crime and Covid-19 cases, as regions with high unemployment typically observe more social unrest and criminal activity. The data on unemployment rate of each state between July and December 2020 is drawn from the Federal Reserve Bank, which was then converted to the time-series-cross-sectional format. Each unique temporal and spatial combination between June and December 2020 is assigned its corresponding unemployment rate.
- Time. The control variable seeks to address the simultaneity concern that may be occurring between the independent and dependent variables. Since the regression test takes the form of a time-series-cross-sectional structure, the month of March in each state investigated has an assigned value of 1 in the Time variable, with the month of April being assigned the value of 2, etc. Here, in the temporal investigation between July and December 2020, data collected in July will be marked with a value of 5, etc.
From the regression summary, non-significant and positive relationships are observed between Covid-19 cases and property crimes and Covid-19 cases and violent crimes from July to December 2020, in the 11 states investigated. The placebo test (H2), supports the findings of H1. In H2, the negative and significant relationship observed in H1 is not observed in the placebo test.
The finding of H2 would signify that Covid-19 cases are statistically significant and negatively associated with both property crimes and violent crimes when shelter-in-place orders were in effect. The findings from H1 and H2 are consistent with the initial hypothesis that Covid-19 cases have a statistically significant and negative relationship with violent crimes during months when shelter-in-place orders were in effect. However, the results from H1 and H2 are different from the initial hypothesis that Covid-19 cases have a positive and significant relationship with property crimes: as results have demonstrated a robust negative and significant relationship between Covid-19 cases and property crimes.
Conclusion
This research finds a statistically significant relationship between Covid-19 cases and property crimes, as well as between Covid-19 cases and violent crimes, during the initial months of the pandemic. With respect to violent crimes, it appears that shelter-in-place restrictions limit the encounters between motivated offenders and potential targets, thus a significant and negative relationship is present. With regard to property crimes, shelter-in-place orders limit potential encounters between motivated offenders and potential properties; or lead to stronger protection of property by figures of security, which would be property owners, as they are asked to remain in close proximity to their related properties. Future research could use other proxies such as home Wi-Fi usage or gasoline consumption to investigate the two potential explanations of the decreases in property crimes.

Yuang Li graduated from Carnegie Mellon University in 2022 with a B.S. in Economics and Politics. While at CMU, he engaged in research investigating issues crossing Economics, Policy, Data, and Business.