Mass Spectrometry
Bruker Ultraflextreme MALDI TOF/TOF MS
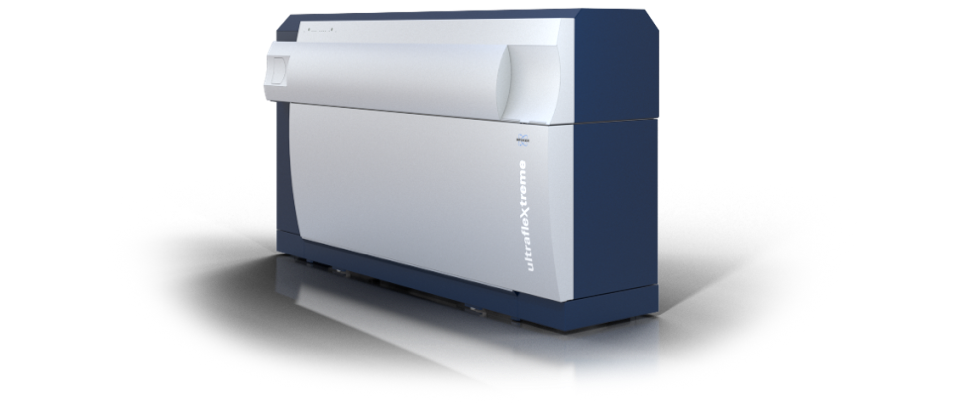
The Bruker UltrafleXtreme is a MALDI (Matrix-Assisted Laser Desorption Ionization) time of flight (TOF) TOF mass spectrometer. It uses delayed-extraction for linear mode, reflectron mode and MS/MS (TOF/TOF using LIFT mode) scans. Gas phase ions are formed via laser ablation and desorption of a solid chemical matrix/analyte sample, and are subsequently accelerated down a 2-meter flight tube. The flight trajectory of the ions in the tube can be modeled kinematically, therefore relating the time of flight to the mass to charge ratio (m/z) of the ion. The matrix compound is typically a small organic molecule, chosen for its ability to absorb photons at 355 nm from the frequency-tripled Nd : YAG laser. In reflectron mode the UltrafleXtreme has high mass resolving capabilities up to 40,000 and ppm mass accuracy. The UltrafleXtreme is also designed for TOF/TOF, a two stage, tandem mass spectrometry technique that can generate and record MS/MS or MS2 spectra. The incorporated LIFT device allows full fragment ion spectra to be acquired within a single scan. Typical analytes are biomolecules, nanoparticles, and synthetic polymers.
Location: MI 551
System Overview:
- Smartbeam laser acquisition speeds:
- Max laser rep rate of 2000Hz for MS
- Max laser rep rate of 1000Hz for MS/MS
- Reflectron mode:
- Resolution up to 40,000
- 1 ppm mass accuracy
- Linear Mode:
- Resolution up to ~2500
- MS/MS or TOF/TOF mode: (LIFT mode) Mass spectra can be acquired with up to 1000 Hz laser repetition rate from low fmol levels within seconds.
- Laser: Solid state frequency-tripled Nd : YAG laser at 355 nm with a Gaussian beam profile.
- Digitization rate: sample rate of up to 4 GS/sec.
- For MS Imaging work:
- Laser focus diameters down to 10 microns for the best spatial resolution imaging.
- Max laser rep rate of 2000Hz for MS
- Max laser rep rate of 1000Hz for MS/MS
Sample Preparation:
- Sample and matrix should be prepared in similar or miscible solvent systems.
- Preparation typically only requires 1µL of sample
- Selecting the proper matrix has a large effect on results. This decision can be based on previous successful MALDI analyses of similar samples, the NIST polymer recipes page for polymer samples, or see the general guide found in the Voyager manual (section 3.1.1 - "Selecting a Matrix").
- Sinapic acid is the most common protein (>10kDa) matrix used.
- α-cyano-4-hydroxycinnamic acid is the most common peptide (<10kDa) matrix used.
- Samples must be completely dry before loading into the instrument.
- For positive ion samples, a small amount of acetic acid or TFA (0.1% v/v) can be added to enhance the signal.
- Approximate recommended sample concentrations are as follow:
- Small peptides: 1-10 pmol/µL
- Proteins: 1-50 pmol/µL
- Polymers: 1-10 mM
User Manuals
- ULTRAFLEXTREME SERIES USER'S MANUAL [.pdf] Please read for training.
- FLEXIMAGING 5.0 WORKFLOWS MANUAL [.pdf] Please read for training.
- BIOTOOLS V3.2 MANUAL [.pdf] Please read for training.
- FLEXCONTROL USER MANUAL [.pdf] Please read for training.
- FLEXANALYSIS USER MANUAL [.pdf] Please read for training.
HTX Matrix Sprayer for MS imaging
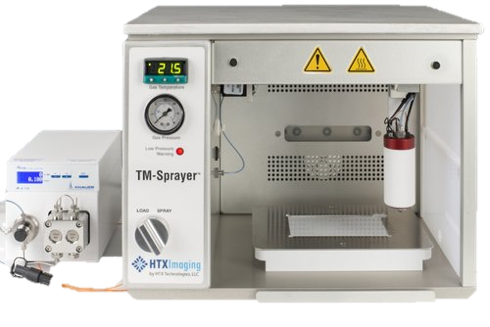
The HTX-TM Spray is a spray-based MALDI sample preparation system that is used to create highly homogenous uniform matrix depositions on a mass spectrometry sample. Mass Spectrometry Imaging (MSI) is a multidimensional MS technique that is used to visualize the spatial distribution of molecules across a sample. To accurately assess molecules across a mass spectral image, the matrix must be deposited equally along all parts of the sample, eliminating “sweet-spots” and inhomogeneities that may exist upon matrix and analyte deposition. The HTX-TM system is a sprayer-based system that allows for uniform, fast, and robust deposition of matrix across a sample. The device can be programmed to control flow rate, temperature, and pressure. Each of these factors play a role in mixing and deposition of matrix onto the sample so that a high quality MS image will result.
System Overview:
- Sub 20-micron matrix droplets
- Highly reproducible and uniform droplet deposition
- Fast sample prep (10-20 minutes per plate)
- Validated for most conventional MALDI matrices and trypsin digestion
- Ability to edit and save method files
- Temperature (up to 130ºC) and gas (up to 30 PSI pressure) can be controlled to improve crystal formation and drying.
- Large flow rate range from 5µL/min – 5mL/min
User Manuals
- HTX TM-SPRAYER USER'S MANUAL [.pdf] Please read for training.
Thermo Scientific LTQ-XL Linear Ion Trap Mass Spectrometer + Thermo Scientific EASY-nLC 1200 Nanoflow Liquid Chromatograph
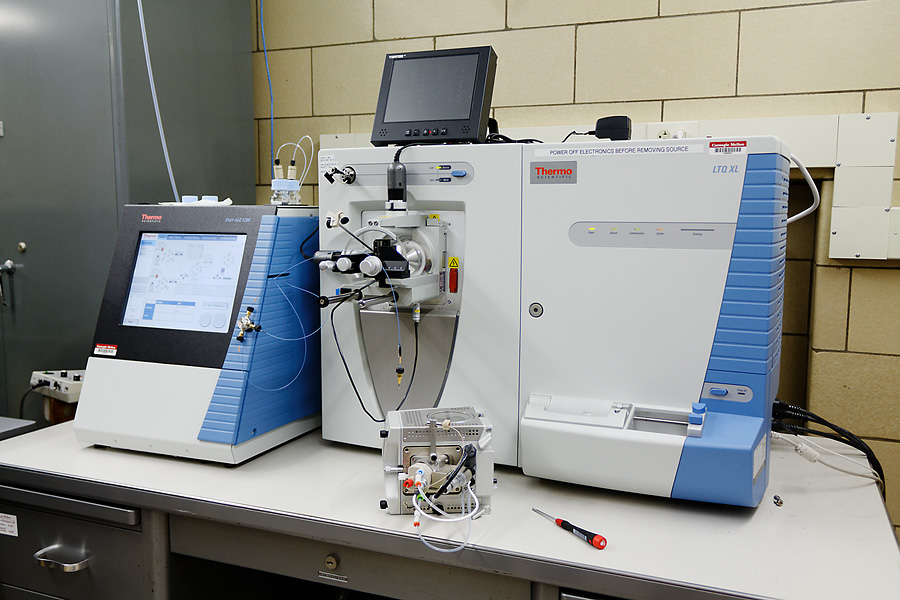
The Thermo Scientific LTQ-XL is a linear ion trap (LIT) mass spectrometer with electrospray ionization (ESI) and atmospheric pressure chemical ionization (APCI) capabilities. The LTQ-XL has MSn capabilities, which is a powerful analytical tool for use in structural analysis. This mass spectrometer can provide molecular weight and sequence information for small peptides (MW below 2000 Da) at the femtomole level with proper analyte introduction. Additionally, liquid seprations prior to MS detection can be made possible by coupling to the Thermo Scientific EASY-nLC 1200 liquid chromatograph with precise gradient flow (water/acetonitrile only) from 20 nL/min to 2 µL/min with pressures up to 1200 bar.
Calibration:
- Automated system calibration performed by CMA staff only
System Overview:
- Mass Ranges: 15-200 Th, 50-2000 Th, 200-4000 Th
- Resolution: 0.05 FWHM with Ultra ZoomScan
- Sensitivity: 250 femtogram reserpine in 1:1 isopropanol:water at 400µL/min flow rate for both MS/MS and MSn.
- ZoomScan for isotopic resolution across full-range scan
- Ultra ZoomScan for ultimate resolution
- Turbo Scan for ultra-fast scan to improve signal-to-noise and sampling rate
- Positive/negative ionization modes
- Multiple Ionization Strategies:
- Electrospray Ionization (ESI) — Thermo Scientific Ion Max Source [.pdf]
- Nanoelectrospray Ionization (nESI) — Thermo Scientific Nanospray Flex Source [.pdf]
- Direct Analysis in Real Time (DART) — IonSense DART-OS Source
- Pulsed Q Collision Induced Dissociation (PQD) enables trapping of low mass fragment ions.
- High Resolution Isolation allows for the separation of an isobaric interfering species down to 0.3 Da or for isolation of thermally labile compounds.
- Automatic Gain Control (AGC) used to ensure ideal number of ions stored in linear ion trap each scan.
- MSn for n=1 to 15 for structural analysis
- Advanced Data Dependent Experiments possible (i.e. Triple Play, Neutral Loss, Ion Tree)
- Linear ion trap with radial ejection. Dual conversion dynode detectors used to capture high capacity of the ion signal.
Sample Preparation:
- All samples should be in an ESI-friendly solvent system such as 50/50 Water/Acetonitrile, Water/Methanol, etc.
- For positive ion samples, a small amount of acetic or formic acid (0.1% v/v) can be added to enhance the signal. TFA is not recommended.
- For direct injection, prepare at least 100µL of sample. For flow-injection analysis 20µL is typically sufficient.
- Recommended sample concentrations are as follow:
- Small organics: 1-10µM
- Small peptides: 1-10µM (pmol/µL)
- Large proteins: 2-10µM (pmol/µL)
- Polymers: 10-100µM
NanoLC Overview:
- Pressure range: 0-1200 bar
- Flow range: 20-2000 nl/min (Recommended: 100-1000 nL/min)
- Samples injected via autosampler
- Software integration with MS and instrument control using Xcalibur 4.0
- NanoViper fitting technology enables low dead volume liquid flow path connectivity. Minimizes peak broadening due to mixing.
- nano-ESI ionization source developed in-house utilizes a 10 µm emitter.
User Manuals
- LTQ-XL Linear Iontrap MS USER'S MANUAL [.pdf] Please read for training.
- EASY-nLC 1200 USER'S MANUAL [.pdf] Please read prior to nLC-MS inquiries.
Thermo Scientific Exactive Plus EMR Orbitrap Mass Spectrometer + Thermo Scientific Vanquish Flex Binary UHPLC
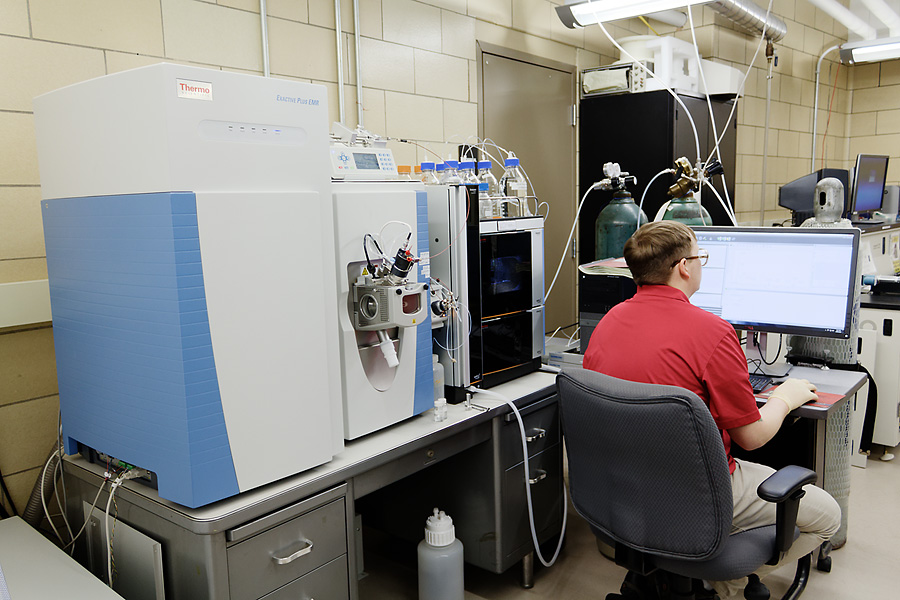
The Thermo Scientific Exactive Plus EMR is a Orbitrap-based electrostatic ion trap mass spectrometer with electrospray (ESI), nanoelectrospray (nESI), and direct analysis in real time (DART) ionization capabilities. The Exactive Plus EMR has high resolution and accurate mass (HRAM) capabilities, providing high confidence molecular weight determinations. This mass spectrometer can provide molecular weight information for small molecules at the femtomole level with proper analyte introduction. Additionally, liquid seprations prior to MS detection can be made possible by coupling to the Thermo Scientific Vanquish Flex Binary UHPLC with precise gradient flow from 0.001-8 mL/min with pressures up to 15,000 psi.
Calibration:
- Automated system calibration performed by CMA staff only
System Overview:
- Mass Ranges: 50-6,000 Th (standard mode), 350-20,000 Th (EMR mode)
- Resolution: Up to 140,000 (FWHM) @ m/z 200
- Mass Accuracy:
- Standard mode: <1 ppm RMS (internal); <3 ppm RMS (external)
- EMR mode (external): <3 ppm RMS (350-6,000 Th); <5 ppm RMS (6,001-10,000 Th); <10 ppm RMS (10,001-15,000 Th)
- Sensitivity: 500 fg buspirone on-column S/N 100:1 acquired with H-ESI II probe
- Max scan rate: Up to 12Hz at mass resolution setting of 17,500 @ m/z 200
- Positive/negative ionization modes
- All-ion-fragmentation (AIF) with either:
- In-source collision-induced dissociation (CID)
- Higher-energy collisional dissociation (HCD)
- Multiple Ionization Strategies:
- Electrospray Ionization (ESI) — Thermo Scientific Ion Max Source [.pdf]
- Nanoelectrospray Ionization (nESI) — Thermo Scientific Nanospray Flex Source [.pdf]
- Direct Analysis in Real Time (DART) — IonSense DART-OS Source
Sample Preparation:
- All samples should be in an ESI-friendly solvent system such as 50/50 Water/Acetonitrile, Water/Methanol, etc.
- For positive ion samples, a small amount of acetic or formic acid (0.1% v/v) can be added to enhance the signal. TFA is not recommended.
- For direct injection, prepare at least 100µL of sample. For flow-injection analysis 20µL is typically sufficient.
- Recommended sample concentrations are as follow:
- Small organics: 1-10µM
- Small peptides: 1-10µM (pmol/µL)
- Large proteins: 2-10µM (pmol/µL)
- Polymers: 10-100µM
UHPLC Overview:
- Pressure range: 290-15,000 psi
- Flow range: 0.001-8 ml/min
- Samples injected via autosampler
- Software integration with MS and instrument control using Xcalibur 4.0
- NanoViper fitting technology enables low dead volume liquid flow path connectivity. Minimizes peak broadening due to mixing.
Additional Information
- Exactive Plus EMR Product Brochure [.pdf] Please read for prior to instrument inquiries.
- Exactive Plus EMR system overview courtesy of Planet Orbitrap.
Applied Biosystems Voyager DE-STR MALDI-TOF
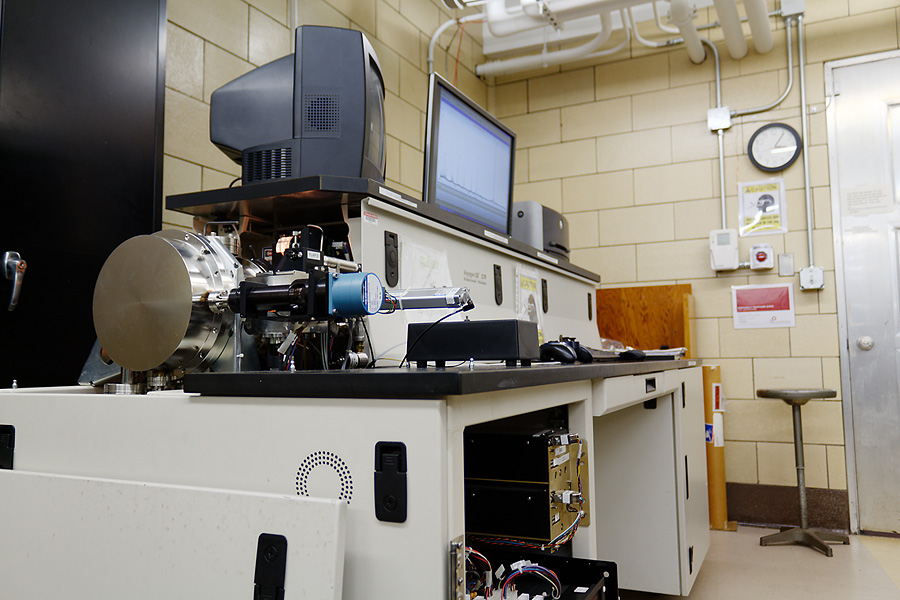
Applied Biosystems (formerly PerSeptive Biosystems) Voyager STR MS is a matrix assisted laser desorption ionization (MALDI) time of flight (TOF) mass spectrometer. Ions are formed in the gas phase from a laser focused onto a matrix/analyte solid sample. The matrix compound is typically a small organic molecule, chosen for its ability to absorb photons at 337 nm from the nitrogen laser. Gas phase ions (positive ions are typically protonated) are then accelerated down the 2 meter flight tube with 20-25 keV of kinetic energy (KE). Low m/z ions hit the detector first followed by the slower, higher m/z ions. To a first order, the ions follow the equation KE=1/2mv2. Typical analyte molecules include polymers, peptides, proteins, and DNA.
Funded by NSF grant #CHE-9808188
Calibration:
- Must be performed on a per-session basis by each individual user
System Overview:
- Mass range 1-400,000 Da
- Positive and negative ion modes
- Linear (R=3000) and reflector (R=15000) modes
- Post-source decay (PSD) with CID
- 337nm nitrogen laser
- 100 well standard sample plate (user-supplied)
- Polymeric analysis tool (PDI, Mn, Mw, Mz calculation)
- 5ppm mass accuracy in reflectron mode with internal reference
- Femtomole-level detection with proper sample preparation
Sample Preparation:
- Sample and matrix should be prepared in similar or miscible solvent systems.
- Preparation typically only requires 1µL of sample
- Selecting the proper matrix has a large effect on results. This decision can be based on previous successful MALDI analyses of similar samples, the NIST polymer recipes page for polymer samples, or see the general guide found in the Voyager manual (section 3.1.1 - "Selecting a Matrix").
- Sinapic acid is the most common protein (>10kDa) matrix used.
- α-cyano-4-hydroxycinnamic acid is the most common peptide (<10kDa) matrix used.
- Samples must be completely dry before loading into the instrument.
- For positive ion samples, a small amount of acetic acid or TFA (0.1% v/v) can be added to enhance the signal.
- Approximate recommended sample concentrations are as follow:
- Small peptides: 1-10 pmol/µL
- Proteins: 1-50 pmol/µL
- Polymers: 1-10 mM
Additional Information
- See how MALDI works!
- Voyager MALDI TOF MS USER'S MANUAL [.pdf] Read Chapters 1,3-5 for training.
- Voyager MALDI TOF MS Quick Guide [.pdf] This guide has been created to guide users through a standard operation of the instrument. There are screenshots and illustrations to assist. It is suggested to use this document during your analyses.
Thermo-Fisher LCQ ESI/APCI Ion Trap
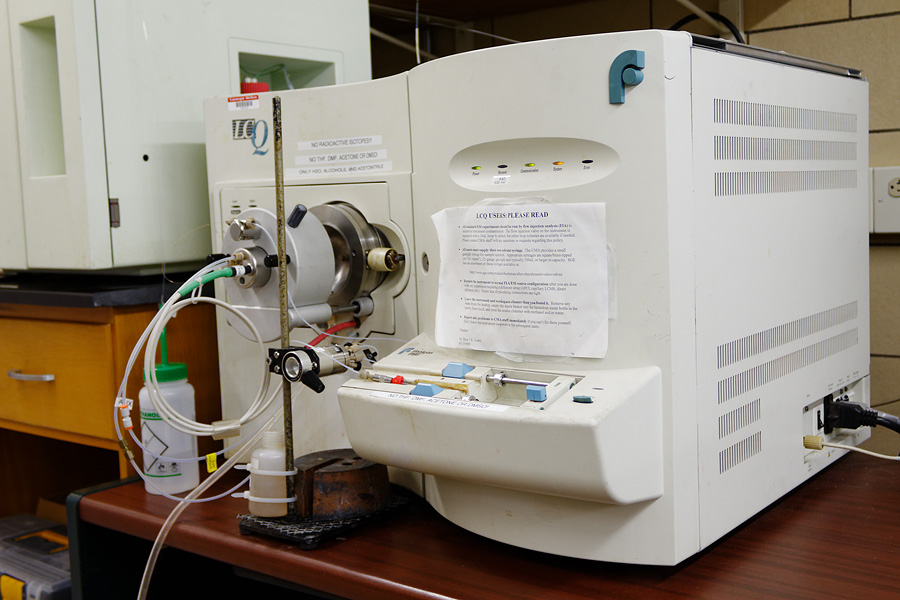
The Finnigan LCQ is a quadrupole field ion trap mass spectrometer with electrospray ionization (ESI) and atmospheric pressure chemical ionization (APCI) sources. The LCQ has MSn capabilities, which is a powerful analytical tool for use in structural analysis. This mass spectrometer can provide molecular weight and sequence information for small peptides (MW below 2000 Da) at the femtomole level with proper analyte introduction.
Calibration:
- Done by CMA staff only
System Overview:
- Optimum mass range 50-2000 m/z, 4000 m/z in limited capacity
- Resolution of >1000 across optimum mass range on a full MS scan
- Zoom and turbo scan features
- Positive / negative ion modes
- ESI and APCI sources
- MSn (i.e. MS-MS-MS-...) mode for structural analysis
- LC-MS capability
- Protein identification with SEQUEST software
- Deconvolution tool for protein mass measurement
Sample Preparation:
- All samples should be in an ESI-friendly solvent system such as 50/50 Water/Acetonitrile, Water/Methanol, etc.
- For positive ion samples, a small amount of acetic or formic acid (0.1% v/v) can be added to enhance the signal. TFA is not recommended.
- For direct injection, prepare at least 100µL of sample. For flow-injection analysis 20µL is typically sufficient.
- Recommended sample concentrations are as follow:
- Small organics: 10-100µM
- Small peptides: 5µM (pmol/µL)
- Large proteins: 20-100µM (pmol/µL)
- Polymers: 100-1000µM
User Manuals
- LCQ Iontrap MS USER'S MANUAL [.pdf] This is the manual for a more recent LCQ. There will be some minor differences. Please read for training.
- LCQ Iontrap MS Quick Guide [.pdf] This guide has been created to guide users through a standard operation of the instrument. There are screenshots and illustrations to assist. It is suggested to use this document during your analyses.