
Physiologic Reactivity
Blood Pressure and Heart Rate Reactivity to Laboratory Stress
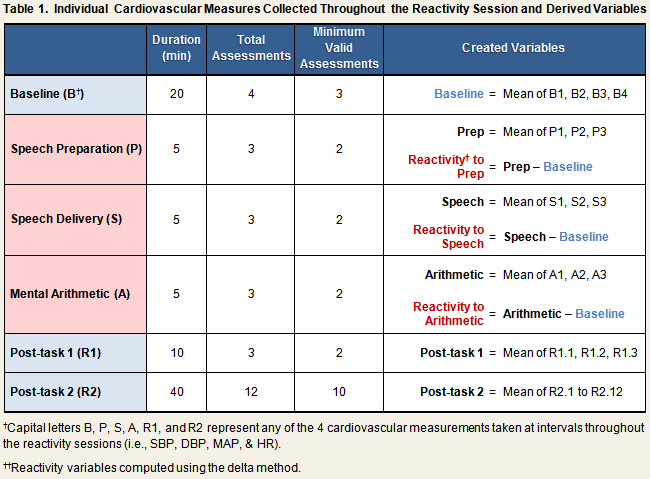
Automated measures of systolic (SBP) and diastolic (DBP) blood pressure, mean arterial pressure (MAP), and heart rate (HR) were taken continually throughout the stress reactivity session (see Reactivity Protocol), and recorded by hand on the laboratory reactivity data collection form. Table 1 displays the number of individual measures that were collected during each phase of the protocol, the minimum number of valid assessments required for the computation of created variables, and the algorithms used to create them. All created variables were computed separately for each reactivity session.
Baseline SBP, DBP, MAP, and HR
As indicated in the first row of Table 1, baseline SBP, DBP, MAP, and HR scores were computed by calculating the mean across the four individual readings that were taken during the baseline phase of the protocol. Baseline scores correlated across reactivity sessions 1 and 2 for all cardiovascular measurements: SBP, r = .66; DBP, r = .59; MAP, r = .59; HR, r = .63; all p < .001.
Task SBP, DBP, MAP, and HR
Task Scores
Five sets of task scores were created for each reactivity session. These variables included the means taken across all measures collected during the speech preparation phase only, during the speech delivery phase only, and during the mental arithmetic phase only (see Table 1, rows 2-4). Also created were variables representing the mean across the speech preparation and speech delivery task scores (speech + prep score), and the mean across the average values for all three task phases (total task score).
Reactivity
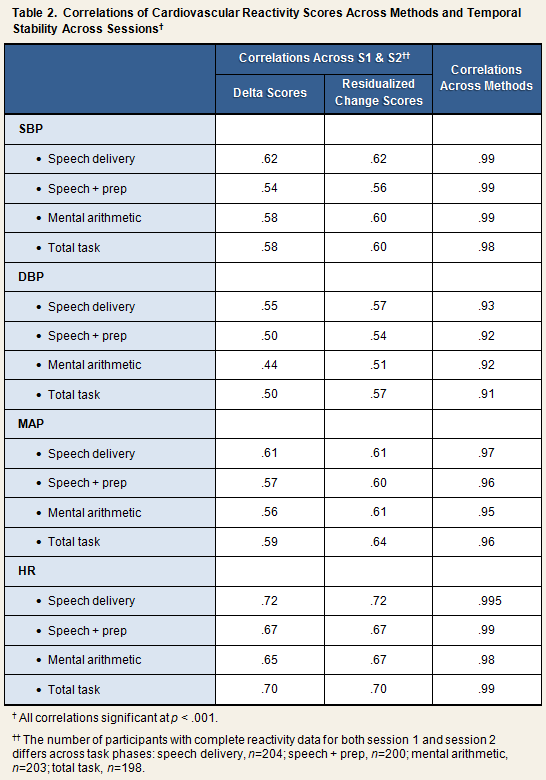
Reactivity scores were computed in two ways, by the delta method and by calculating residualized change scores. For the former method, simple difference scores were created by subtracting the baseline score of a given measure from the task phase score (Table 1). Accordingly, systolic reactivity to mental arithmetic would be computed by subtracting the baseline SBP score from the mental arithmetic SBP score. Residualized change scores were computed by regressing the task phase score on the relevant baseline score, and saving the residual (i.e., [observed value] – [predicted value]). As can be seen in the first 2 columns of Table 2, reactivity scores computed by the delta method and the residualized change method correlated equally well across session 1 and session 2.
Post-Task SBP, DBP, MAP, and HR
Post-Task Scores
Two sets of post-task scores were created, with one representing the first 10 minutes of recovery and the second representing the last 40 minutes of recovery. Post-task 1 scores were computed by taking the mean across the first three assessments collected during the recovery period. Post-task 2 scores were computed by taking the mean across the last 12 assessments collected during the recovery period (see Table 1).
Recovery
Because we have not yet analyzed the post-task data, the data set does not contain any variables representing cardiovascular recovery from the laboratory stressor. Several methods have been derived for modeling cardiovascular recovery, including the creation of difference scores with respect to baseline (i.e., post-task score – baseline score) and adjustment for reactivity (Manuck et al., 1989), and latent growth curve modeling (Llabre et al., 2004). The raw data we provide are, at minimum, sufficient for either of these two methods.
References
Llabre, M. M., Spitzer, S., Siegel, S., Saab, P. G., & Schneiderman, N. (2004). Applying latent growth curve modeling to the investigation of individual differences in cardiovascular recovery from stress. Psychosomatic Medicine, 66, 29-41.
Manuck, S. B., Kasprowlcz, A. L., Monroe, S. M., Larkin, K. T., & Kaplan, J. R. (1989). Psychophysiologic reactivity as a dimension of individual differences. In N. Schneiderman, S. M. Weiss, & P. G. Kaufman (Eds.), Handbook of Research Methods in Cardiovascular Behavioral Medicine. New York, NY: Plenum, pp. 365-382.
Resting Heart Rate Variability (HRV) and Changes in HRV in Response to Stress (PCS3)
Physiologic response to aversive stimuli is thought to result from a combination of sympathetic activation and parasympathetic withdrawal. Spectral analysis of heart rate variability (HRV) can provide an estimation of the relative extent to which each component of the autonomic nervous system contributes to the overall stress response. The rhythmic components of HRV aggregate within high, low, very-low, and ultra-low frequency bands. High-frequency (HF) oscillations are thought to be mediated by vagal activation; whereas low-frequency (LF) oscillations are thought to be mediated predominantly by sympathetic activation. Thus, in response to stress, one would expect HRV to display a higher ratio of LF to HF than during rest.
Estimation of HRV from Data Collected During the Stress Reactivity Protocol
Details on the sequence of events that took place during the acute stress protocol can be found on the Stress Reactivity Laboratory Procedures page.
Electrocardiogram (EKG) data for assessment of HRV were collected continuously throughout baseline, each of the 3 task phases, and during the first 10 minutes of the post-task recovery period (Post-task 1). Interbeat interval (IBI) sequences were extracted from EKG signals using an automated IBI extraction algorithm (Mindware Version 2.51, Mindware Technologies, LTD., Gahanna, OH) and a sampling frequency of 250 Hz, as per Task Force recommendations (Malik, 1996). Extracted IBI records were then inspected for artifacts and edited manually. HRV was evaluated in 5-minute epochs: 4 epochs during baseline; 1 during each task phase; and 3 during the post-task recovery. High and low frequency power were estimated by spectral analysis of interbeat intervals (IBIs) using a Fast Fourier transform (FFT) algorithm (Duhamel & Vetterli, 1990). HF band power was computed as the sum of the powers corresponding to any peaks centered in the range of 0.12 Hz to 0.40 Hz; LF band power, in the range of 0.04 Hz to 0.12 Hz; and very low frequency (vLF) band power in the range of 0.003 Hz to 0.04 Hz. HF, LF, vLF, and the LF:HF ratio for each measured epoch were computed automatically by the Mindware analysis software. Average values of all four variables were computed for the baseline and post-task reactivity periods by taking the mean across the 4 or 3 measured epochs, respectively. Likewise, overall task HF, LF, vLF, and LF:HF ratios were computed by averaging values across the three task phases.
References
Duhamel, P., & Vetterli, M. (1990). Fast Fourier transforms: A tutorial review and a state of the art. Signal Process, 19, 259-299.
Malik, M. (1996). Heart rate variability: Standards of measurement, physiological interpretation and clinical use. Task force of the European Society of Cardiology and the North American Society of Pacing and Electrophysiology. Circulation, 93(5), 1043-1065.
Cortisol Reactivity to Laboratory Stress
Saliva samples for measurement of cortisol were collected continually throughout the stress reactivity session (see Reactivity Protocol). The first sample was obtained prior to participants entering the reactivity chamber. All remaining samples were collected during the actual reactivity protocol, as outlined below.
- End of baseline phase (1 sample)
- End of task phase (i.e., immediately following completion of mental arithmetic; 1 sample)
- Every ten minutes during the 50-minute post-task phase (5 samples)
The data set includes variables representing the raw cortisol data obtained from each of the 8 saliva collections for both stress reactivity sessions (see PCS3 Trial Outline).
Reactivity
The hypothalamic-pituitary-adrenal (HPA) axis response to stress is delayed relative to that of the sympathetic nervous system (SNS). Thus, elevations in cortisol are expected to emerge within 30 minutes of being exposed to a stressful stimulus rather than immediately thereafter, as occurs with cardiovascular response. Computation of cortisol reactivity, then, requires incorporation of the cortisol measurements obtained during the post-task period. Because we have not yet analyzed the cortisol data collected during the two reactivity sessions, the data set does not contain variables specifically representing cortisol reactivity to the laboratory stressor. Examples of how cortisol reactivity has been operationalized in existing research are referenced below.
References
Earle, T. L., Linden, W., & Weinberg, J. (1999). Differential effects of harassment on cardiovascular and salivary cortisol stress reactivity and recovery in women and men. Journal of Psychosomatic Research, 46(2), 125-141.
Roy, M. P., Steptoe, A., & Kirschbaum, C. (1998). Life events and social support as moderators of individual differences in cardiovascular and cortisol reactivity. Journal of Personality and Social Psychology, 75(5), 1273-1281.