
Daily Symptoms in Quarantine
Studies
PCS1, PCS2, PMBC, PCS3
Copyright Information
Not a copyrighted scale
Primary References
Cohen, S., Doyle, W. J., Skoner, D. P., Rabin, B. S., & Gwaltney, J. M., Jr. (1997). Social ties and susceptibility to the common cold. Journal of the American Medical Association, 277, 1940-1944.
Gwaltney, J. M. Jr., Moskalski, P. B., & Hendley, J. O. (1980). Interruption of experimental rhinovirus transmission. Journal of Infectious Diseases, 142, 811-815.
Jackson, G. G., Dowling, H. F., Spiesman, I. G., & Boand, A. V. (1958). Transmission of the common cold to volunteers under controlled conditions. I. The common cold as a clinical entity. Archives of Internal Medicine, 101, 267-278.
Purpose
The scale is designed primarily to assess whether and to what extent participants experienced several symptoms characteristic of upper respiratory illness (URI) during the preceding 24 hours, but also includes a number of items pertaining to past-day experience of nonspecific somatic symptoms. In the 3 Pittsburgh Cold Studies and PMBC, URI symptoms assessed daily while in quarantine were used to determine whether participants met one of several criteria comprising the subjective definition of a clinical cold (i.e., modified Jackson criteria [Gwaltney et al., 1980], see Assessment of Infection and Colds). Importantly, in order for a diagnosis for a cold to be made, a participant first must be determined to have been infected with the challenge virus before the subjective symptom criteria can be applied.
Type of Measure
Created
Description
Content
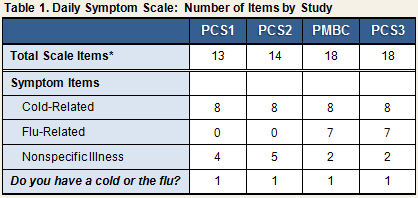
The total number of symptoms included in the scale differed across studies (see Table 1).
- In all of the studies, the Daily Symptom Scale included 8 items asking participants to rate the severity of a set of physical symptoms identified by Jackson and colleagues (1958) as being characteristic of the common cold, as well as to report whether they think they have a cold or the flu (yes/no).
- All studies also asked participants to rate the severity of a range of non-specific illness symptoms (e.g., upset stomach, backache, poor appetite).
- In PMBC and PCS3, participants reported on their experience of additional physical symptoms related to complications of respiratory viral infection (sinus pain [sinus infection], earache [ear infection], chest congestion [bronchitis]) and on symptoms characteristic of flu-related illness (muscle aches, joint aches, sweating, fever).
- In PCS2, PMBC, and PCS3, the scale also included an open-ended item for participants to list any additional symptoms that they might have experienced in the past 24 hours. (Because reports of participant-generated symptoms were rare, “additional symptom” data are not included in the Common Cold Project data set.)
Administration
In PCS1, PCS2, PMBC, and PCS3, the Daily Symptoms Scale was administered as a self-report questionnaire on quarantine day 0 and at the end of each subsequent post-challenge quarantine day. Using a 5-point scale, participants rated the severity of their experience of several physical symptoms during the course of the preceding 24 hours.
Scaling
0 = none, 1 = mild, 2 = moderate, 3 = severe, 4 = very severe
Number of Items
As discussed above, the studies were identical in terms of cold-related symptoms, but the number and type of additional symptoms varied (see Table 1). Specific items are discussed in additional detail below.
The eight cold symptoms included in all four studies are listed below. These eight symptoms also were assessed during the Daily Interviews administered in PCS2, PMBC, and PCS3.
- Nasal congestion
- Sneezing
- Runny Nose
- Sore throat
- Cough
- Headache
- Chills
- Malaise/feeling “under the weather”
In addition to the eight cold symptoms, symptoms characteristic of flu-related illness and complications of flu were included in PMBC because that study challenged participants with Influenza A in addition to rhinovirus. Assessment of these symptoms simply was carried over to PCS3, despite participants being challenged only with RV39, which causes the common cold (see Table 2).
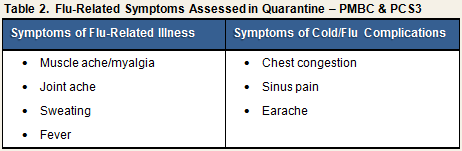
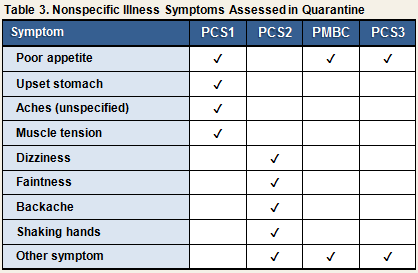
Table 3 displays the nonspecific illness symptoms that were assessed in each study. These items were intended to evaluate general somatic complaints not specific to the common cold.
Variables/Scoring
Variables representing daily measures taken during quarantine are summarized in Table 4. The data set contains the raw data representing participants’ responses to the Daily Symptom Scale items, as well as several computed variables. Because the primary outcome of the studies was the development of clinical illness following experimental exposure to an upper respiratory virus, changes in cold symptom ratings from pre- (baseline) to post-challenge were of most interest. Several of the variables described in Table 4 reflect this focus. For example, for each cold/flu symptom, an adjusted daily symptom severity score was computed by subtracting the DAY 0 severity score from the severity score reported on each subsequent post-challenge day. If adjustment for day 0 resulted in a negative value, the adjusted value was rescored to 0. The data set includes variables representing both raw and adjusted values.
Total adjusted daily cold symptom scores, hereafter referred to as adjusted Jackson Symptom Scores, were computed by summing adjusted daily values for the 8 cold-related symptoms within each post-challenge quarantine day (i.e., nasal congestion, sneezing, runny nose, sore throat, cough, headache, chills, and malaise/feeling “under the weather”)1.

In addition to the daily variables, the data set also contains a number of summary variables that aggregate data across the post-challenge days.
- total number of days reporting individual symptoms (e.g., total days with cough, total days with runny nose, etc.)
- total number of days reporting cold or flu
- average severity scores for individual symptoms
- average adjusted daily cold symptom count
- average Total Jackson Symptom Score
In the Cold Studies, these summary variables were used to determine whether participants infected with the challenge virus met the modified Jackson criteria (Gwaltney et al. 1980), which are comprised of having an average adjusted Jackson Symptom Score of 6 or higher and either reporting having a cold/flu on one or more post-challenge days or reporting 3 or more days with rhinorrhea (runny nose). Participants meeting these criteria in addition to having been infected with the challenge virus were considered to have developed a cold based on the subjective definition (see Assessment of Infection and Colds).
2Symptom ratings used in the creation of the original Jackson criteria (Jackson et al., 1958) were rated on a scale of 0 to 3, and the criterion score was a total of 14 points over a post-challenge observation period of 6 days. As with the modified criteria, individuals also had to report having a cold or experiencing 3 or more days with rhinorrhea.