Relationship Closeness
Title
Relationship Closeness Inventory (RCI)
Study
PMBC
Copyright Information
Copyright owned by the American Psychological Association (APA)
Primary Reference
Berscheid, E., Snyder, M., & Omoto, A. M. (1989). The Relationship Closeness Inventory: Assessing the closeness of interpersonal relationships. Journal of Personality and Social Psychology, 57(5), 792-807.
Purpose
To measure the closeness of significant interpersonal relationships. The RCI conceptualizes closeness in terms of the degree of interdependence between relationship partners as evidenced by the nature of their daily activities. Items focus on the frequency and strength of one partner’s influence on the other, and the diversity of shared activities.
Type of Measure
Modified. The original scale asked respondents to consider their closest relationship within each of 5 social domains: work, family, romantic, friend, and “other”. For PMBC, the RCI was modified to evaluate the spouse/partner relationship only, and thus was administered only to those participants who reported being married or involved in a marital-like relationship.
Description
The RCI consists of three subscales, with each designed to assess a specific dimension of the spouse/partner relationship: (1) frequency of impact, (2) diversity of joint activities, and (3) strength of partner influence. The frequency subscale is comprised of 3 items that assess the amount of time that the respondent spent alone with his or her spouse or partner during the past week. The diversity subscale consists of a checklist of several specific activities, and respondents are instructed to endorse any activity in which they engaged with their spouse or partner during the past week. The strength subscale is comprised of several items that measure the degree to which the respondent believes that the spouse or partner influences his or her decisions on issues in various life domains.
Scaling
Frequency subscale items: open-ended
Diversity subscale items: 0 = did not do this; 1 = did do this
Strength subscale items: 7-point visual analog scale (1 = strongly disagree, 7 = strongly agree)
Number of Items
75 (3 frequency, 38 diversity, 34 strength)
Psychometrics
In undergraduate students
Berscheid and colleagues (1989) evaluated the RCI in a sample of college students at the University of Minnesota (116 males & 125 females; mean age 19.38; range 18-49). The relationship types measured included romantic (n=114), friend (n =87), and family (n=34).
Internal consistency reliability (averaged across all 3 relationship types)
- Frequency subscale, alpha = 0.56
- Diversity subscale, alpha = 0.81
- Strength subscale, alpha = 0.90
Test-retest reliability (3-5 weeks; n = 75)
- RCI total score, r = 0.82
- Frequency subscore, r = 0.82
- Diversity subscore, r = 0.61
- Strength subscore, r = 0.81
In PMBC (n=55)
Internal consistency reliability
- Frequency subscale, alpha = 0.67
- Diversity subscale, alpha = 0.86
- Strength subscale, alpha = 0.90
Scoring
Raw Scores
Frequency subscale: total minutes spent with spouse/partner each day (morning + afternoon + evening)
Diversity subscale: sum of all endorsed events (range = 0 to 38)
Strength subscale: sum of items rci.s1 to rci.s34 (with the following items reverse-scored prior to computation: rci.s2, rci.s6, rci.s7, rci.s9, rci.s11, rci.s12, rci.s14, rci.s15, rci.s17, rci.s19, rci.s21, rci.s24, rci.s26)
Converted Scores
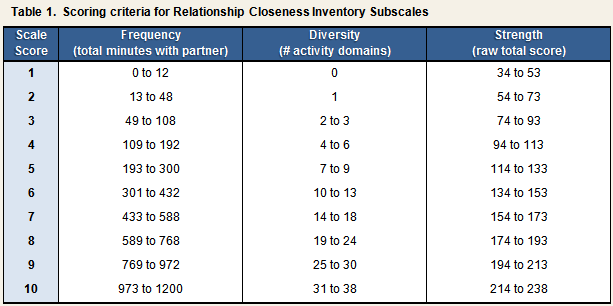
Following computation, each subscale raw score is converted into a common 10-point metric, with higher values indicating greater closeness on each dimension (see Table 1). Using these converted scores an overall index of relationship closeness is calculated by summing across the subscales (total scale range = 3 to 30).
Variables
RCI Frequency Score
RCI Diversity Score
RCI Strength Score
RCI Total Relationship Closeness Score