A (climate change) tale of 115 cities
Has the city where I live gotten hotter? Does it rain more or has it gotten drier? Are there more days of extreme heat? In short, what's going on with climate change in my specific location?
"That is actually a very difficult question to answer," according to Dave Dzombak, professor and head of Carnegie Mellon University's Department of Civil and Environmental Engineering (CEE).
The big picture of global climate change has been close to unanimously agreed upon by the scientific community, and, increasingly, by a majority of Americans: Earth is heating up, sea-levels are rising, and weather events are becoming more frequent and extreme. And while these broad patterns are well understood, the story of local climate change is more varied.
For instance, the average annual temperature today in New York City is more than four degrees warmer than at the beginning of its climate record in 1869. But just 300 miles east in Pittsburgh, things are actually cooler now compared to the late 19th century. And while Baltimore has seen an increase in precipitation, a short drive down I-95 to Washington D.C., environmental conditions are drier now compared to the beginning of climate records in those cities. When you zoom in past broad regions to focus on individual cities, "there are a lot of interesting stories," Dzombak said.
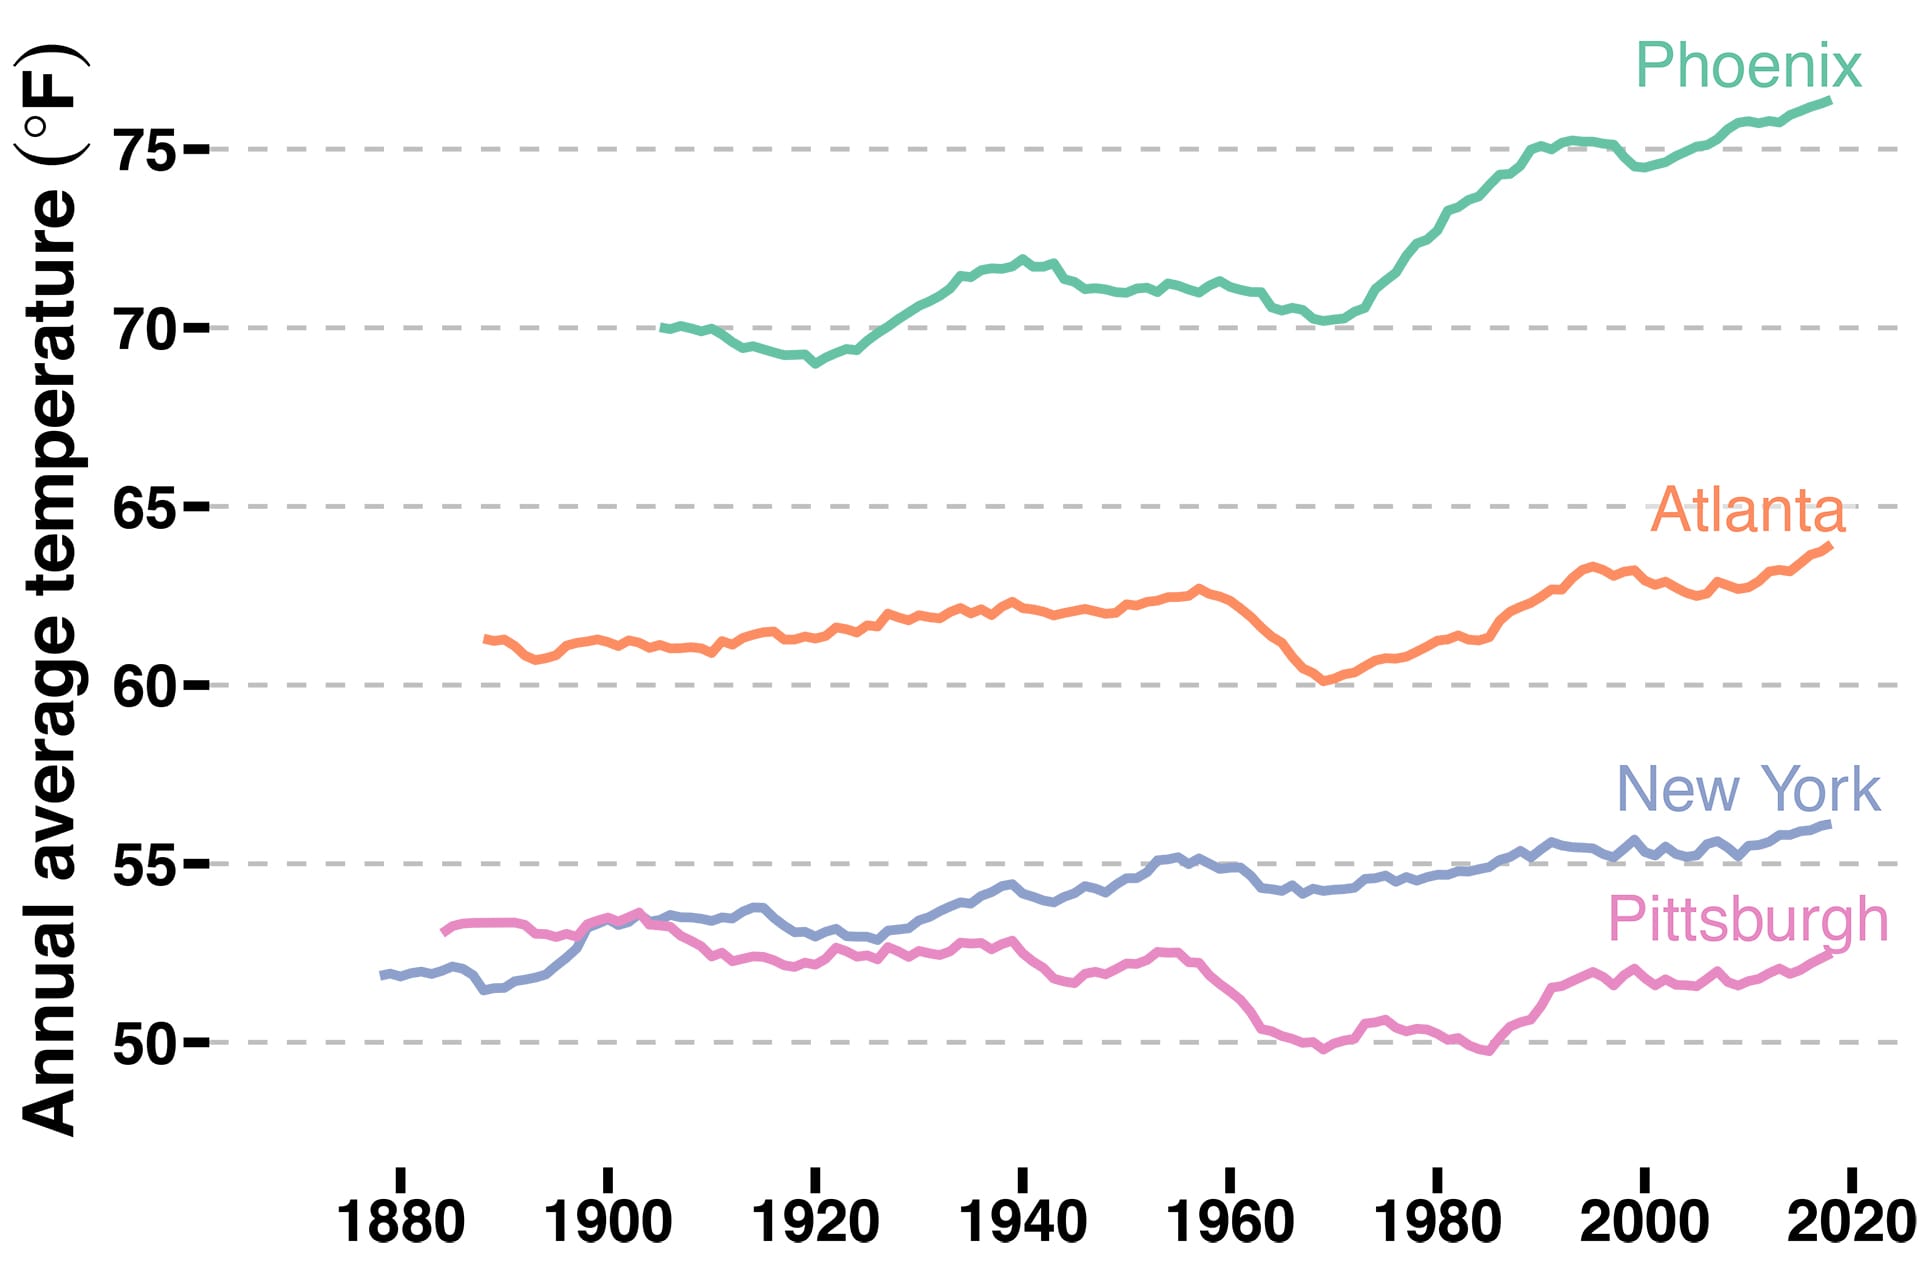
U.S. cities see climate change differently. Some have warmed a lot (Phoenix), while others have cooled (Pittsburgh).
Zooming in on these city's stories, however, has been a difficult task until now.
In a Journal of Climate article, CEE Ph.D. student Yuchuan Lai and Dzombak published the climate histories for more than 100 U.S. cities, constructed from daily measurements of temperature and precipitation dating back as far as 150 years.
Despite the long existence of climate measurements at weather stations across the U.S., records at any single station can be spotty (missing data over long stretches) or only cover limited periods of time. And data from different weather stations are spread out across disparate databases, making it difficult (or impossible) to finding a complete record for a particular city.
Moreover, large-scale climate assessments aggregate temperature and precipitation data across many different stations. This approach alleviates issues related to spotty data, and is useful for assessing regional climate changes (e.g. there is more precipitation today in the Northeastern U.S.). But, it inherently glosses over the climate histories of specific places.
Driven by the question "what's going on with the climate in particular locations?" Lai and Dzombak used data science tools to compile records for as many places in the U.S. as they could. Using National Weather Service databases from the National Oceanic and Atmospheric Administration, they systematically combined data across different time periods and closely located weather stations to create a composite climate history for each location. Now, the question above can be answered readily for more than 100 U.S. cities. Their results are available for download and open use.
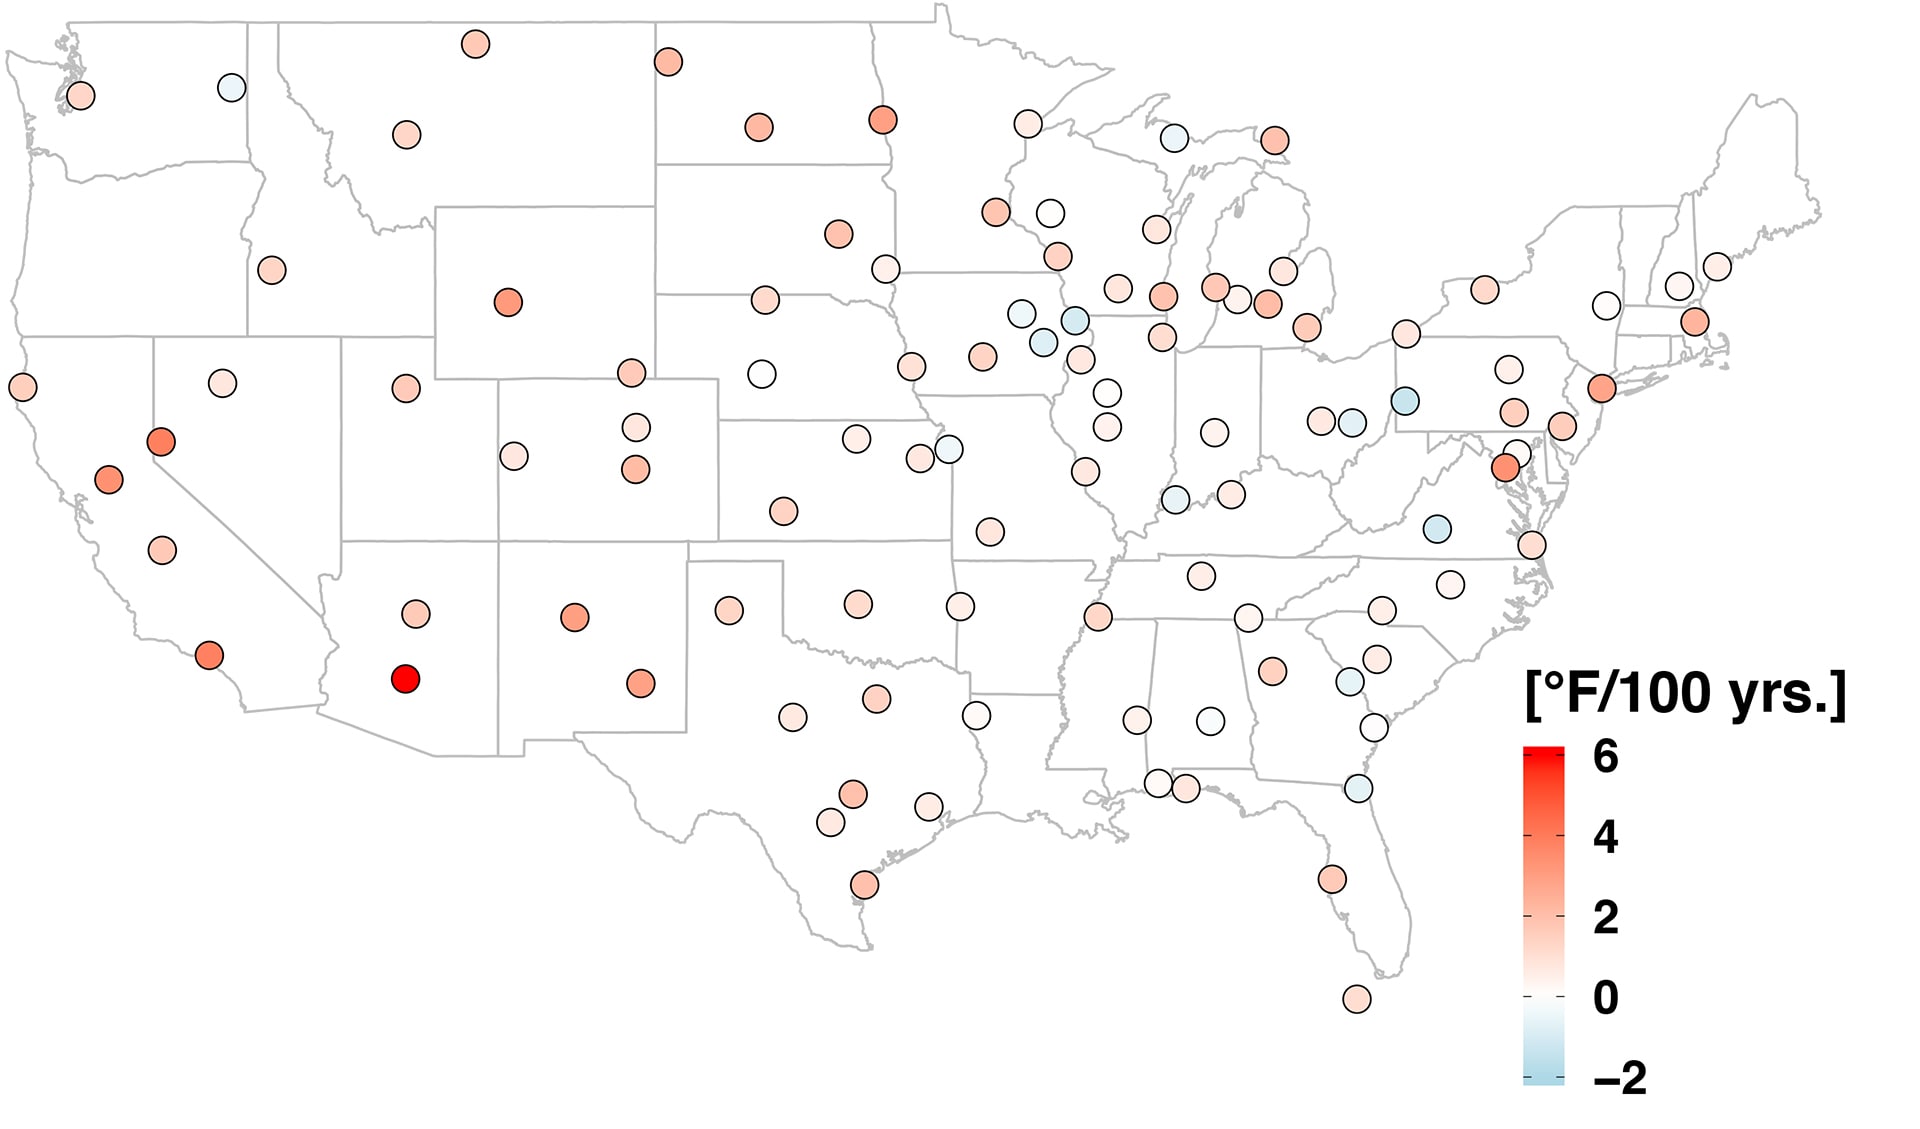
Rate of temperature change: While temperatures in most cities across the U.S. have gone up over the past 100+ years, the story is anything but uniform across the U.S. This map shows that the individual stories of climate change can be quite variable across U.S. cities, even between cities that are close in distance.
Moreover, large-scale climate assessments aggregate temperature and precipitation data across many different stations. This approach alleviates issues related to spotty data, and is useful for assessing regional climate changes (e.g. there is more precipitation today in the Northeastern U.S.). But, it inherently glosses over the climate histories of specific places.
Driven by the question "what's going on with the climate in particular locations?" Lai and Dzombak used data science tools to compile records for as many places in the U.S. as they could. Using National Weather Service databases from the National Oceanic and Atmospheric Administration, they systematically combined data across different time periods and closely located weather stations to create a composite climate history for each location. Now, the question above can be answered readily for more than 100 U.S. cities. Their results are available for download and open use.
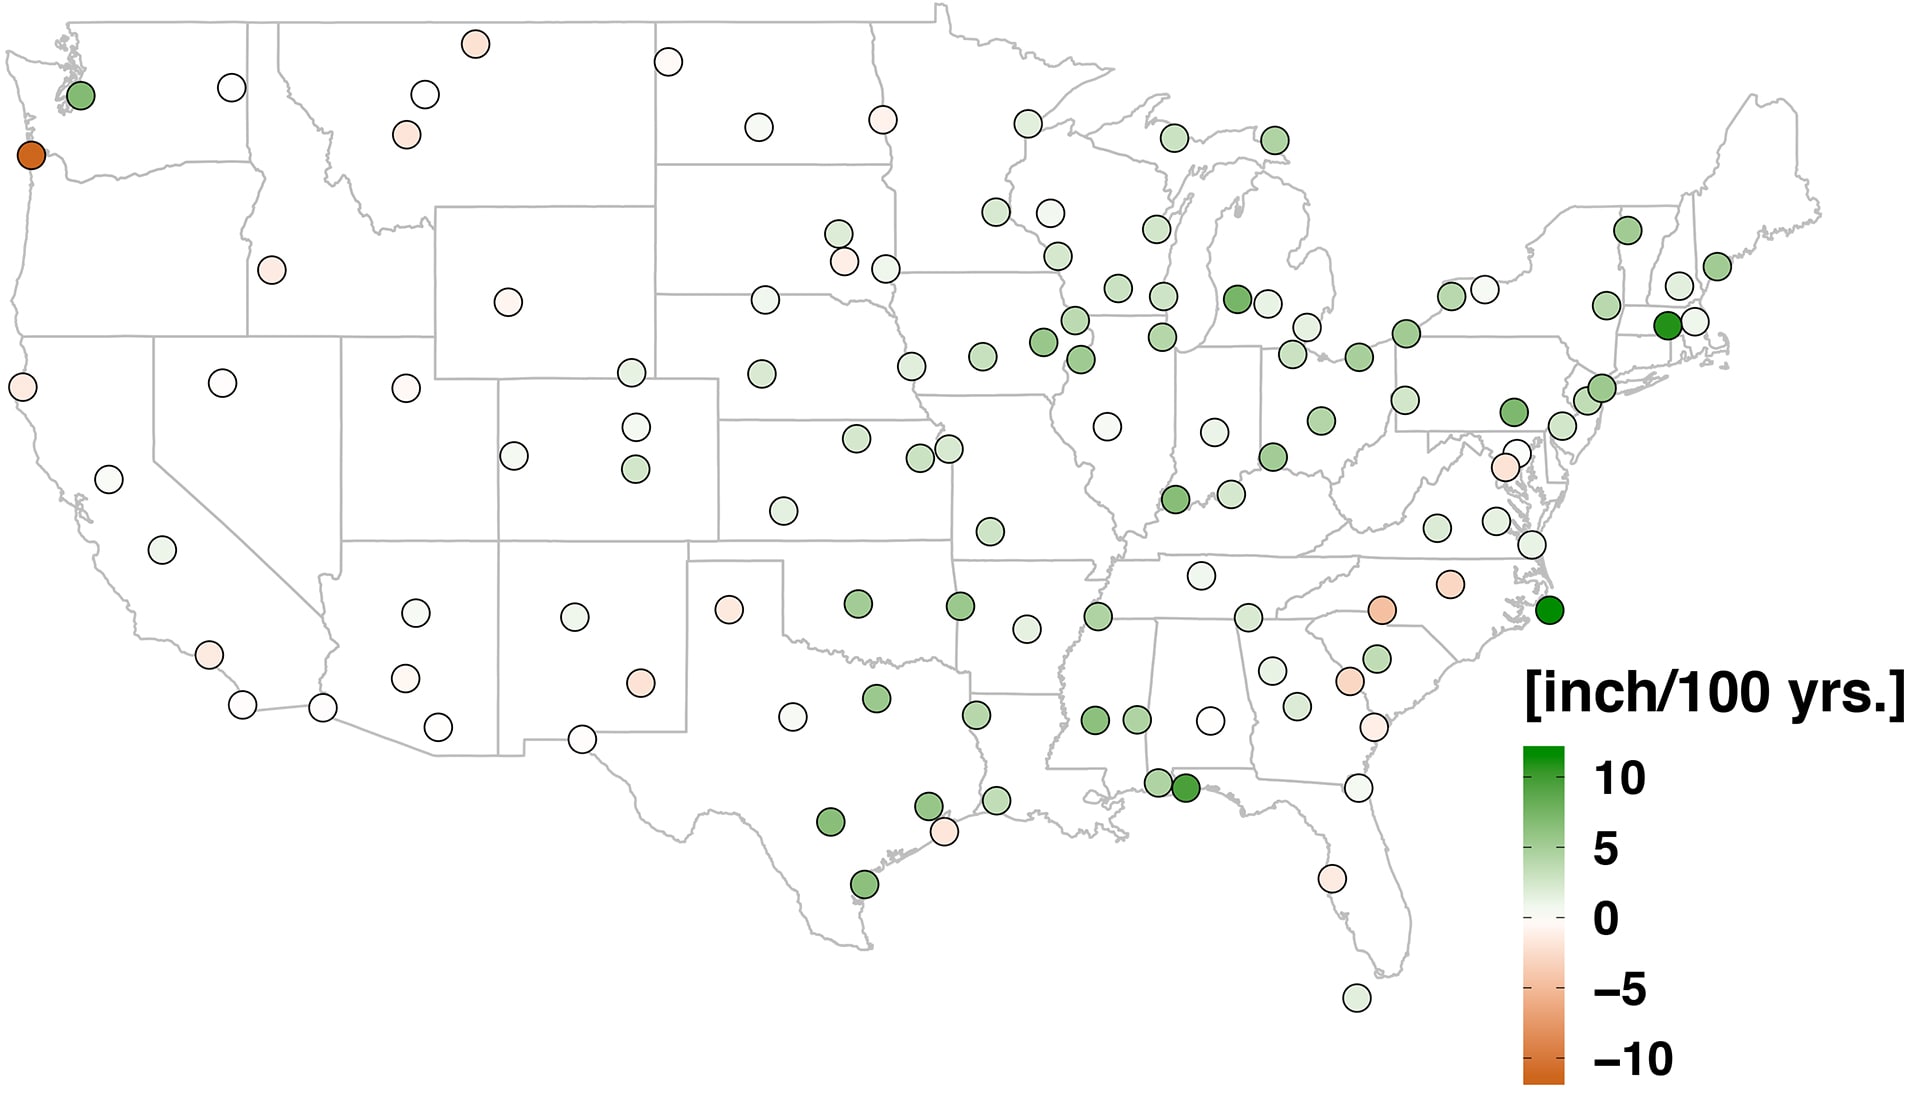
Rate of precipitation change: Similar to temperature, there are regional differences in precipitation that emerge from the city-level records. For instance, it is getting drier in much of the Western U.S., but wetter in the Midwest and Northeast. However, idiosyncrasies emerge when zooming into the city level. Baltimore has gotten slightly wetter while Washington, DC has gotten drier over each city's respective climate record.
Such city-level climate records are of interest to civil and environmental engineers, as well as urban planners and infrastructure managers, as location-specific information informs design choices for future projects. For example, drainage systems for highways must be built to accommodate rain deluges, and heating-cooling systems for buildings need to anticipate both the coolest and hottest days. Despite broad patterns, specific places have had their own unique changes in climate, and the future will be no different.
Moving forward, Lai and Dzombak are working on extrapolating their city-level climate records to make near-term projections (1-20 years). This is a different approach from physics-based climate models, which are intended to be useful for broad areas and longer time periods, but do not capture differences between cities with great accuracy.
"We're proposing an alternative," said Lai, by "making projections based on the historical data." These statistical models, the focus of Lai's current work, will help engineers make infrastructure design and management decisions tailored to meet a city's unique future climate demands over the coming decades.
"As an engineer, I need climate information for the specific place where I'm working. I'm not interested in average climate change across North America," said Dzombak. "I'm interested in Pittsburgh, or Phoenix or wherever my project is located."