Web Tool Helps People Visualize, Make Sense of Large Complex Datasets
Carnegie Mellon’s EVA Cuts Its Teeth on U.S. Census Employment Data
By Byron Spice / 412-268-9068 / bspice@cs.cmu.edu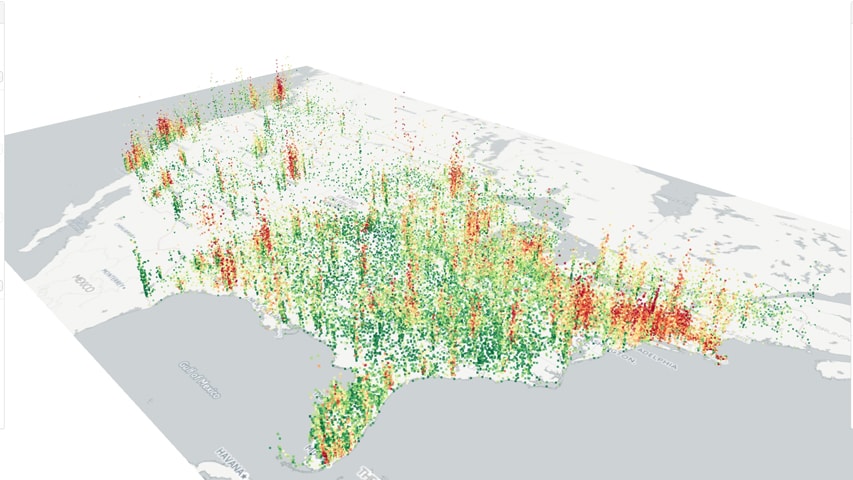
Datasets for everything from gene expression to employment demographics are growing so large and complex that automated methods sometimes seem the only way to glean knowledge from them. But a new web-based tool being developed at Carnegie Mellon University provides the option to keep human judgment and intuition in the analytic loop.
Called Explorable Visual Analytics, or EVA, the tool uses a novel computer architecture that enables the analyst to explore raw data through dynamic visualizations with minimal time delay. It’s designed to help users make sense of “high-dimensional” data – that is, data with lots of parameters.
“We can explore massive datasets without downloading them all,” said Saman Amirpour Amraii, a senior system/software engineer who developed EVA along with Amir Yahyavi, a post-doctoral researcher, both of the CREATE Lab in Carnegie Mellon’s Robotics Institute. The bulk of the data can reside in an external network, while EVA downloads to the user’s computer only that portion being analyzed.
If data are displayed on a map, the user can zoom in on an area of interest and EVA automatically will grab and process the data of the highest resolution that will fit in the window — and only that data. The highly efficient data processing pipeline Yahyavi and Amraii created includes pre-processing and caching of data on servers, compressing data to limit the use of communications bandwidth and caching data on the client computer for better responsiveness.
“We can explore massive datasets without downloading them all.” — Saman Amirpour Amraii
“We are able to give users the illusion they are working with all of a massive dataset while actually sending only a small proportion of the data to the client,” Yahyavi said.
EVA’s rapid response enables users to quickly explore different parameters and examine them using the most appropriate types of graphics.
EVA also helps in communicating findings from the data, Amraii said, enabling users to not only share their conclusions, but the process used to reach those conclusions. And, because EVA preserves links to the underlying data, subsequent viewers can explore the data themselves to consider alternative analyses.
“It keeps the presenters honest,” said Randy Sargent, senior systems scientist. “If they cherry pick the data, it will be obvious.”
To refine the design of EVA, the researchers have explored a multi-dimensional, 100-gigabyte database on the workforce from the U.S. Census Bureau’s Longitudinal Employer-Household Dynamics (LEHD) program. For instance, they have used EVA to analyze the racial makeup on neighborhoods in Philadelphia, highlighting rapid shifts from single-race communities to mixed-race neighborhoods in the course of just a few years.
The LEHD database is available for public exploration via EVA. Videos demonstrating how EVA can be used are available.
“We hope to apply EVA to all sorts of high-dimensional data,” Sargent said. The researchers have begun using it to analyze deforestation information from the World Resources Institute as well as transportation data from the U.S. Department of Transportation.
“When you have data with high dimensionality, it can be difficult finding patterns or even navigating through it all,” Sargent noted. It also can serve as a general purpose numerical data visualizer for business analytics.
Keeping the system speedy and responsive was a major goal in its development, Amraii said. Data analysts rarely start with the right questions, he explained, and finding the right ones can require any number of tweaks and adjustments.
“To do knowledge exploration, the system has to be fast,” he said, emphasizing the importance of maintaining a train of thought. “If it takes a half hour to get an answer to your query, you may forget why you asked in the first place.”
This research was supported by Google Inc.