Electrophysiological Source Imaging
EEG/MEG Source Imaging
The aim of this project is to develop source imaging algorithms and technology that images the current density dipoles in the brain which generate surface electroencephalogram (EEG) and magnetoencephalogram (MEG) signals. Our lab developed a subspace imaging algorithm – FINE, to localize the current dipole in the brain volume (3D) with high resolution (Xu et al. 2004). This method was further advanced (Ding & He 2006) and was later successfully employed (in combination with connectivity measures) to determine the seizure onset zone (SOZ) from EEG recordings (Ding et al., 2007; Lu et al. 2012). We have applied our source imaging ideas in conjunction with other modalities such as functional MRI (fMRI) to study the relationship between epilepsy and deep brain structures such as the Thalamus (Zhang et al. 2015).
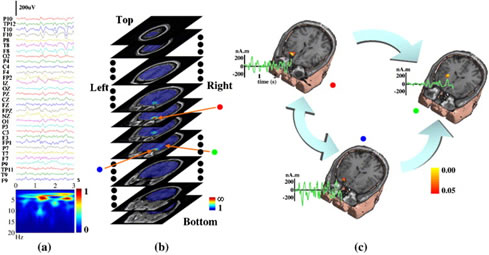
An example of seizure source-connectivity imaging. Locations (pseudo-colors on MRI images), waveforms (green curves), and connectivity patterns (big arrows) for these sources. The connectivity analysis revealed the "red" and "blue" sources are "primary" sources which are well correlated with MRI visible lesions. (from Ding et al., NeuroImage, 2007).
Our laboratory has advanced sparse signal processing for brain source localization since its early days (Ding & He 2008), and has recently developed a new sparse imaging algorithm denoted by IRES which not only localizes the underlying location of the underlying source but also provides an objective estimate of its extent as well (Sohrabpour et al. 2016). We have validated this approach in determining the SOZ in epilepsy patients and found our approach concordant with clinical findings. This could potentially be a useful tool in determining the SOZ from non-invasive EEG/MEG measurements.

An example of sparse imaging algorithm (IRES) applied to a focal epilepsy patient. The inter-ictal spikes are localized in this patient and compared to clinical findings such as the resection volume (in green) and SOZ electrodes determined by the physician (denoted by pink electrodes). IRES provides an extended solution based on convex optimization theory and sparse signal processing algorithms (from Sohrabpour et al, NeuroImage 2016).
Applying source imaging algorithms to dynamic events such as the ictal events is extremely important as brain processes are dynamic and change over time. We have developed a source imaging approach capable of imaging spatio-temporal processes in the brain (Yang et al. 2011), specifically seizures; this algorithm is named dynamic seizure imaging (DSI). This algorithm has been validated in epilepsy patients (Lu et al. 2012). We have used dynamic imaging algorithms in our lab to study the relationship of brainwave spectra in the brain and seizure type and severity (Yang et al. 2012).

Schematic diagram of dynamic seizure imaging (on the left) and an example of applying DSI to a focal epilepsy patient who became seizure-free after surgery (on the right). The clinical findings are concordant with DSI results (from Yang et al., NeuroImage, 2011).
Eelectrophysiologcal Connectome (eConnectome)
Electrophysiological source imaging (ESI) can be used to localize underlying brain activity; and mapping the functional connectivity within the brain. Our laboratory, in collaboration with Drs. Fabio Babiloni and Laura Astolfi at the University of Rome, has pioneered the electrophysiological connectome approach integrating ESI from EEG/MEG with functional connectivity mapping in the source domain such as Granger causality (Babiloni et al., 2005). The lab has proposed and published the first journal article on source imaging of functional connectivity associated with epilepsy (Ding et al. 2007), and also developed a free open source toolbox called eConnectome (He et al., 2011) which has been downloaded more than 3,200 times.
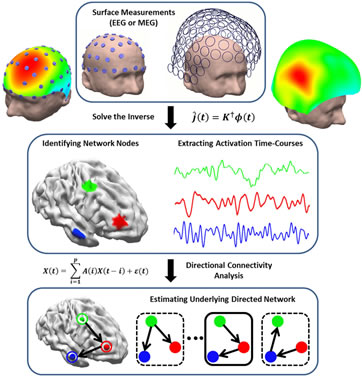
The Electrophysiological Connectome (eConnectome) Concept (from Sohrabpour et al., IEEE Trans. Biomed. Eng., 2016).
Cardiac Electrical Imaging
It is significant to noninvasively image cardiac electrical activity throughout the three dimensional (3D) myocardium. The lab has pioneered the development of 3D cardiac electrical imaging from noninvasive body surface ECGs. We have developed novel 3D cardiac electrical tomography techniques to image cardiac current density distributions within the myocardium (He & Wu, 2001); a heart-model based tomographic imaging approach to localize the site of origin of cardiac activation (Li & He, 2001), image the transmembrane potential distribution (He et al., 2003) within the 3D anisotropic myocardium, and image 3D cardiac activation based on a peak-criterion (Liu et al., 2006). An important work is to rigorously validate 3D cardiac electrical imaging approach using plunge needle electrode recordings. We have successfully validated, in collaboration with Dr. Steve Pogwizd at the University of Alabama, cardiac electrical imaging in passed activity and arrhythmias (Zhang et al., 2005; Han et al., 2011,2012, 2013). We have further advanced the technology by directly evaluating the clinical applicability in patients with arrhythmias including atrial fibrillation, premature ventricular contraction patients (Zhou et al., 2016; Yu et al., 2017). These works are highly promising and may lead to establishment of 3D cardiac electrical tomography technology for functional cardiac imaging, aiding catheter ablation of arrhythmias and other applications.
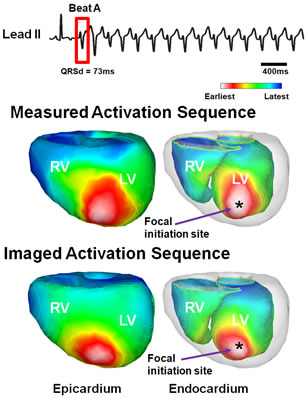
3D cardiac electrical imaging of cardiac arrhythmia (from Han et al., American Journal of Physiology-Heart and Circulatory Physiology, 2015).