Trip Planning
Utilizing the high-fidelity electric vehicle model within INCEPTS, we can analyze individual routes to determine if the specified vehicle can make the trip under the given local and environmental conditions.
Massachusetts Case Study
For this case study, the wind and temperature data came from the NREL Windtool Kit and were recorded on 12/21/15 at 12:00 pm while the elevation data came from the USGS national elevation map. To highlight the capabilities of the high-fidelity vehicle model within INCEPTS, a single route is used for the simulated vehicles in this analysis.
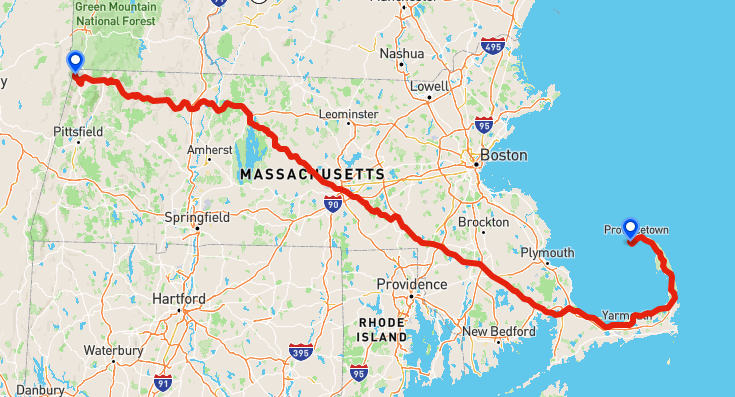
The route chosen for this analysis, as seen in the above diagram, has one endpoint near Williamstown, MA and the other endpoint near Provincetown, MA. This route is approximately 263 miles long and was determined using the A* navigation algorithm built within INCEPTS. For these simulations, the electric vehicles stop following the route if the State of Charge (SoC) in the battery gets below 30%. The first vehicle chosen for this analysis is an electric pickup truck.
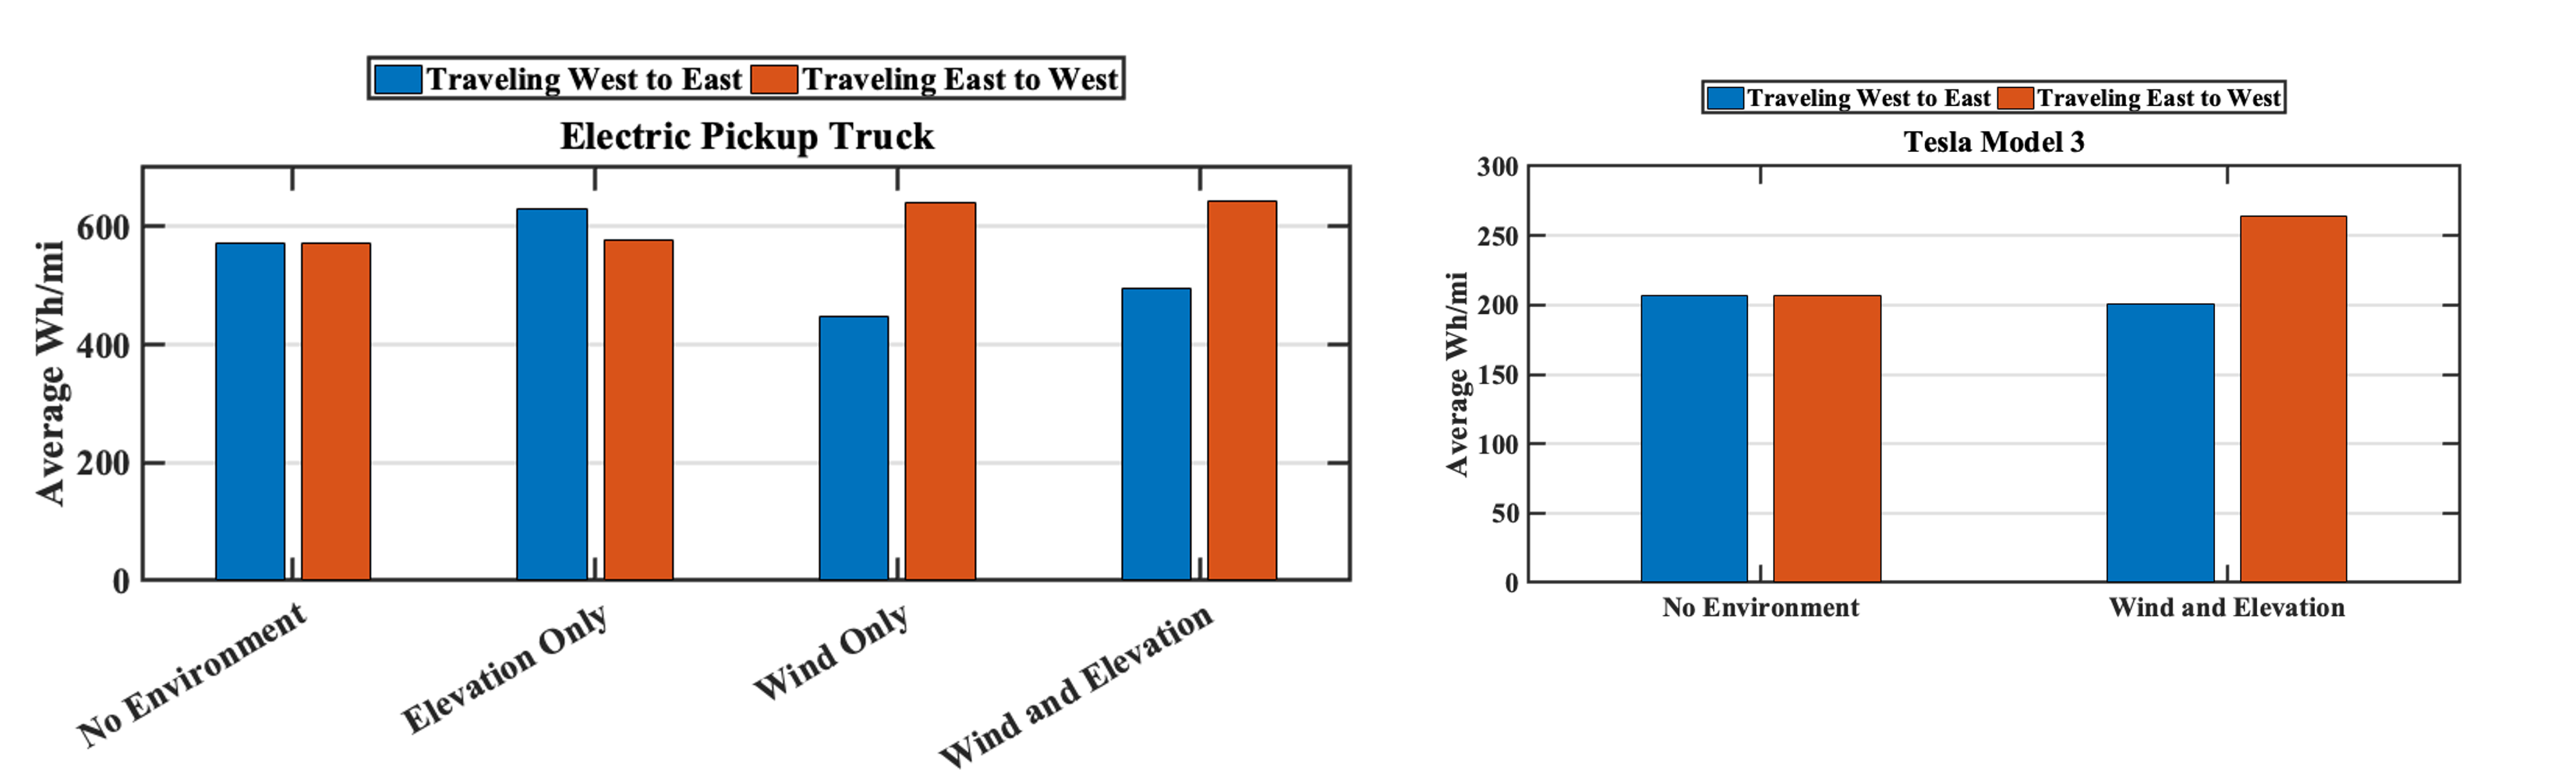
The first set of simulations is designed to quantify how much the environmental factors impact the energy requirements of the vehicle. To do this, the environmental factors, elevation change and wind in this case, are added in one at a time to demonstrate their respective impacts. In addition, the vehicle traveled in both directions of the route to fully capture how the environment affected the energy requirements. The results of these simulations are shown in the above figure. The “No Environment” case is the same regardless of the direction of travel and was found to have an average energy requirement of 570 Wh/mi, a metric that is similar to the MPG metric for gas-powered vehicles. Looking at the simulations with all of the environmental factors, the vehicle traveling from West to East had an average energy requirement of 495 Wh/mi while the vehicle traveling East to West had an average energy requirement of 643 Wh/mi. When looking at the Tesla Model 3, the “No Environment” simulation required an average of 206 Wh/mi while the West to East simulation with all of the environmental factors required an average of 200 Wh/mi and the East to West simulation with all of the environmental factors required an average of 264 Wh/mi. While the two different vehicle types had different average energy required per mile of travel due to the differences in the vehicle characteristics, they both had similar results when comparing the average energy used per mile traveled between the vehicles traveling in opposite directions. In the case of the electric pickup truck, the vehicle traveling from East to West required about 30% more energy per mile traveled than the vehicle traveling from West to East; in the case of the Tesla Model 3, the vehicle traveling from East to West required about 32% more energy per mile traveled than the vehicle traveling from West to East.
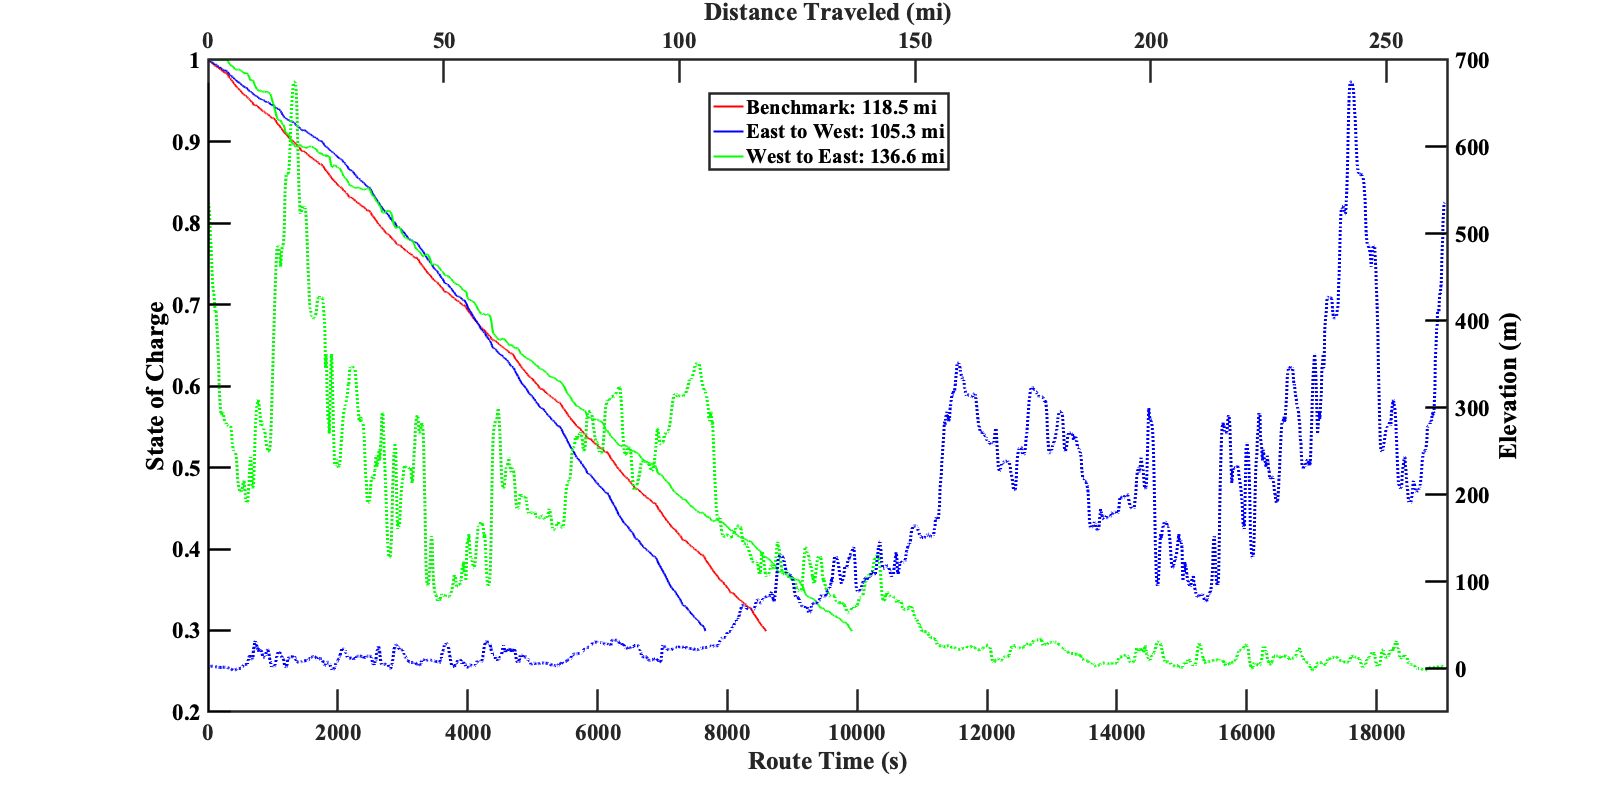
The image above shows the SoC trends that resulted from the aforementioned simulations where the solid lines are the SoC trends and the dotted lines are the elevation profiles along the traveled route. The Benchmark is the SoC trend for the vehicle in the “No Environment” simulation and represents what one would expect if only the manufacturer’s specifications were considered. As a result of the larger energy requirement per mile, the vehicle traveling from East to West went 21 miles less than the vehicle traveling from West to East; a difference of about 15%. This is a significant change in the distance traveled which was due to the environmental impact on the vehicle’s power requirements. Thus, it is important to include this type of analysis in electric vehicle trip planning, charger infrastructure deployment and other policies surrounding electric vehicles otherwise the vehicle may not be able to complete the route as expected or the chargers may not be properly deployed and will not be able to service the electric vehicles as needed.
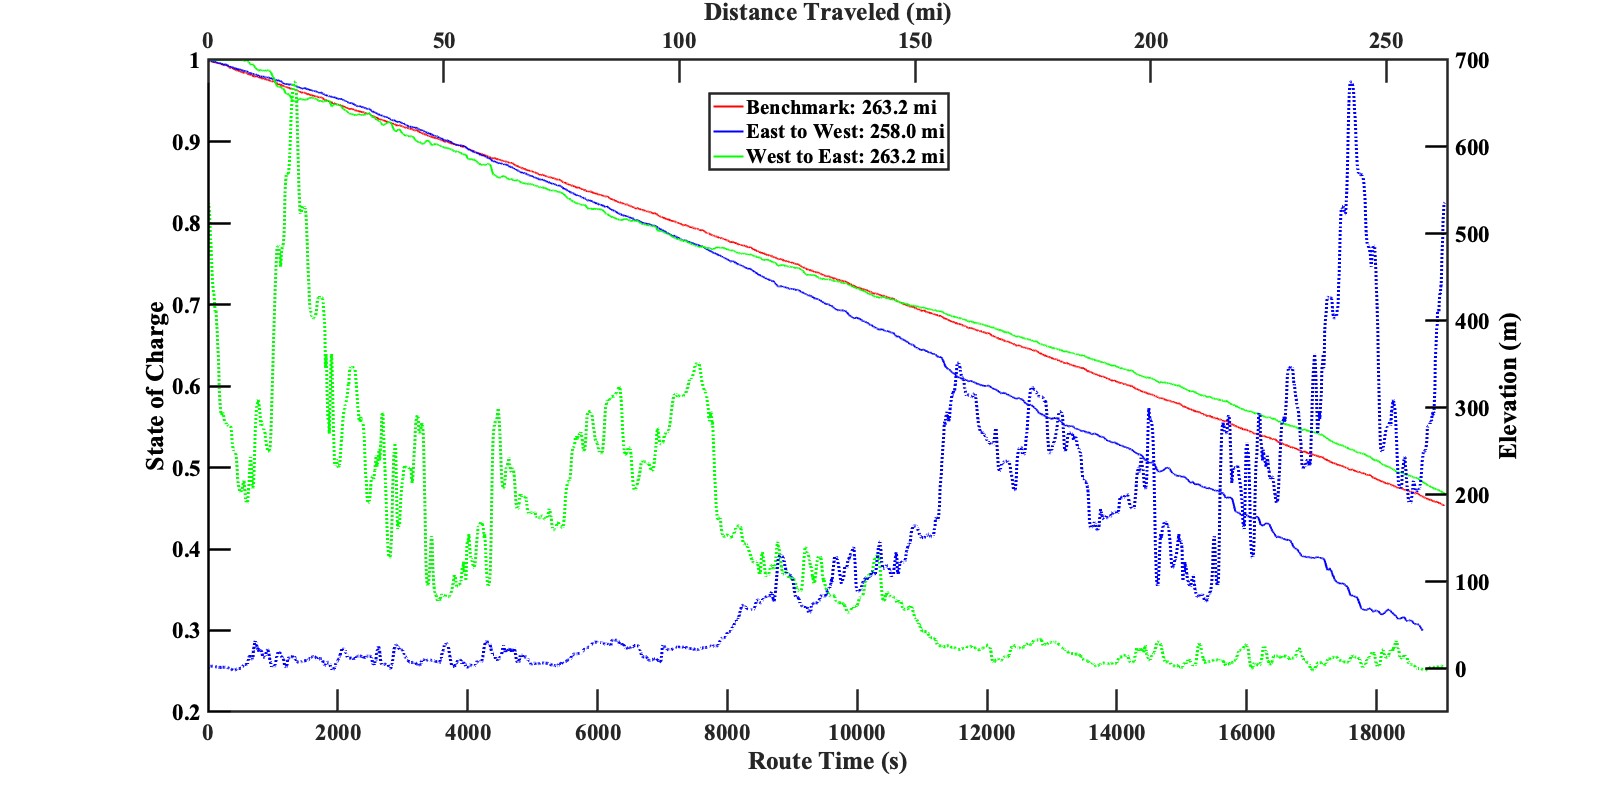
The image above shows the SoC trends that resulted from the similar simulations except now the vehicle is a Tesla Model 3. These trend lines show a similar story as above where the vehicle that traveled from West to East was able to complete its route with plenty of energy left in the battery while the vehicle that traveled from East to West hit the 30% SoC threshold 5 miles before it reached its destination.
People


Alec Bills
