Fleet Analysis
Utilizing the complex system analysis tools and high-performance computing capabilities within INCEPTS, we can analyze the performance of electric vehicle fleets within a target location under various local and environmental conditions.
Massachusetts Case Study
For this case study, we used 1000 Tesla Model 3s which were all given a random start and destination within Massachusetts. The wind and temperature data for this analysis came from the NREL Windtool Kit and were recorded on 12/21/15 at 12:00 pm. The elevation data for this analysis came from the USGS national elevation map.
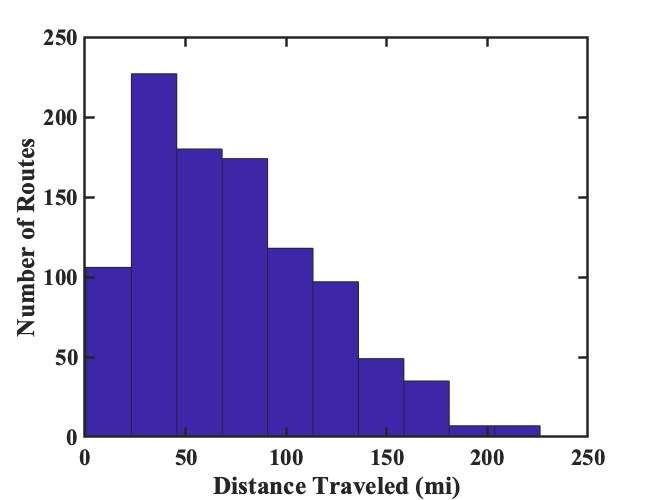
This histogram shows the distribution of route distances traveled by each of the simulated vehicles. For this analysis, the average route distance was 73.3 miles while the longest traveled route was 226.2 miles.
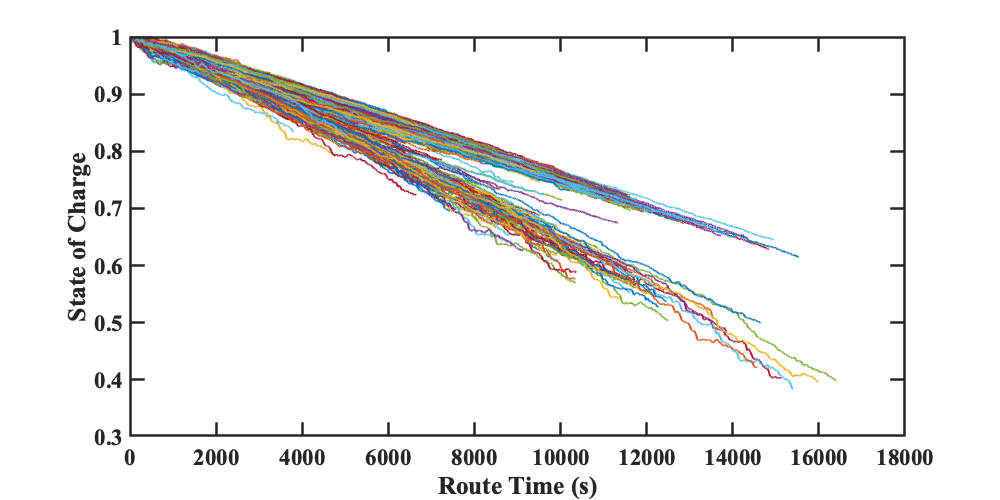
This image shows the State of Charge (SoC) trends for each of the simulated vehicles where the larger route time trends correspond to the vehicles that traveled the furthest distances. This image shows a bimodal split in the SoC trends of the longer routes where, for example, one vehicle traveled 206.2 miles and ended its route with 64.6% SoC while another vehicle traveled 212.7 miles and ended its route with 38.4% SoC. This means that two vehicles that traveled routes that differed by only 6.5 miles ended their respective routes with a difference in their battery’s SoC of 26.2%. This enormous gap is due to the variation in the environmental conditions experienced by the two vehicles.
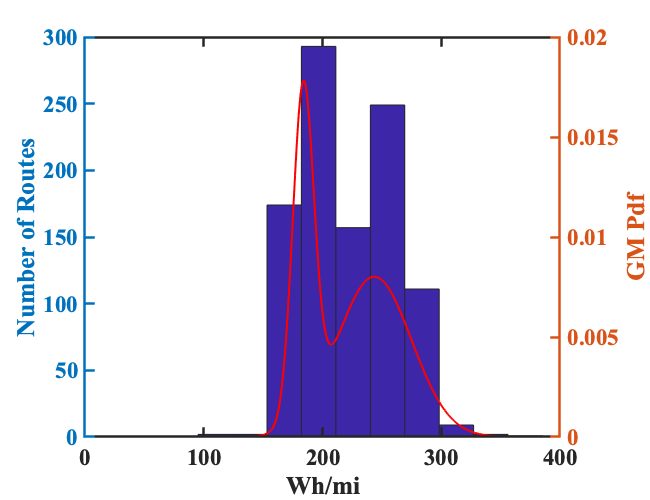
The previously demonstrated bimodality is shown again in the above figure which shows a histogram of the average energy used per mile, a metric similar to the MPG metric used in gas-powered vehicles, traveled by the simulated vehicles as well as a fit Gaussian Mixture PDF. The Gaussian Mixture PDF shows that the first peak of the bimodality occurs at 184 Wh/mi while the second peak occurs at 244 Wh/mi. The disparity between the two peaks can have major implications on the vehicle’s ability to reach a charging station if it is not accounted for in the deployment of the charging infrastructure.
The bimodality observed in this case study is a result of the geometric constraints within Massachusetts, resulting from the road network, and the environmental conditions. These results are unique to the INCEPTS framework which analyzes these complex trends by incorporating all of the different factors that can impact the vehicle’s performance. A traditional, discrete approach would not be able to capture these high-level trends which are inherent to the INCEPTS approach.
People

