Dashboards
Since 2020, the Sustainability Initiative has been compiling information and developing dashboards as a resource for the campus community. The three dashboards address the Global Goals through practices, education, and research, and help people find potential collaborators across the institution. Many organizations, committees, and student groups are committed to furthering progress on the Global Goals. Work towards environmental, social, and economic sustainability can be found linked below. If you have a question about the analysis or would like your course, research, activity, or group to be included, please contact us at sustainability@cmu.edu.
The education and research Tableaus below are internal resources accessible to anyone with an AndrewID. You must be connected to the CMU VPN and request access, which will be automatically granted.
Practices
This Tableau includes university practices. Each activity was manually tagged by the Sustainability Initiative team with up to three Global Goals and linked to the source website so that anyone interested in how CMU is addressing a goal can easily access the relevant information. Please note that some links may only be accessible to CMU students, faculty, or staff. Is there an activity missing? Do you think a practice or operation is related to different goals? Is a link missing or broken? Let us know by contacting sustainability@cmu.edu.
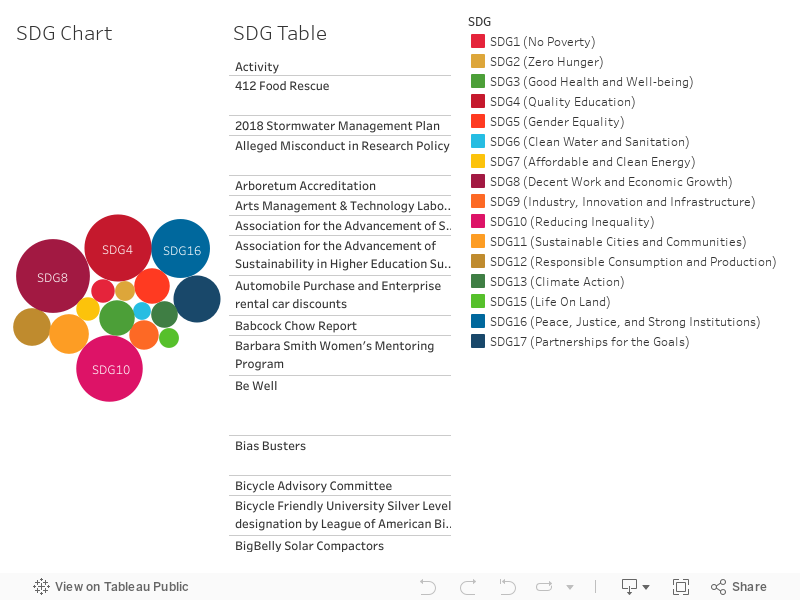
Carnegie Mellon is committed to making its digital content accessible to individuals with disabilities. If you have accessibility questions or encounter any content that you believe is not satisfactorily accessible, please contact the Office of Disability Resources.
Education
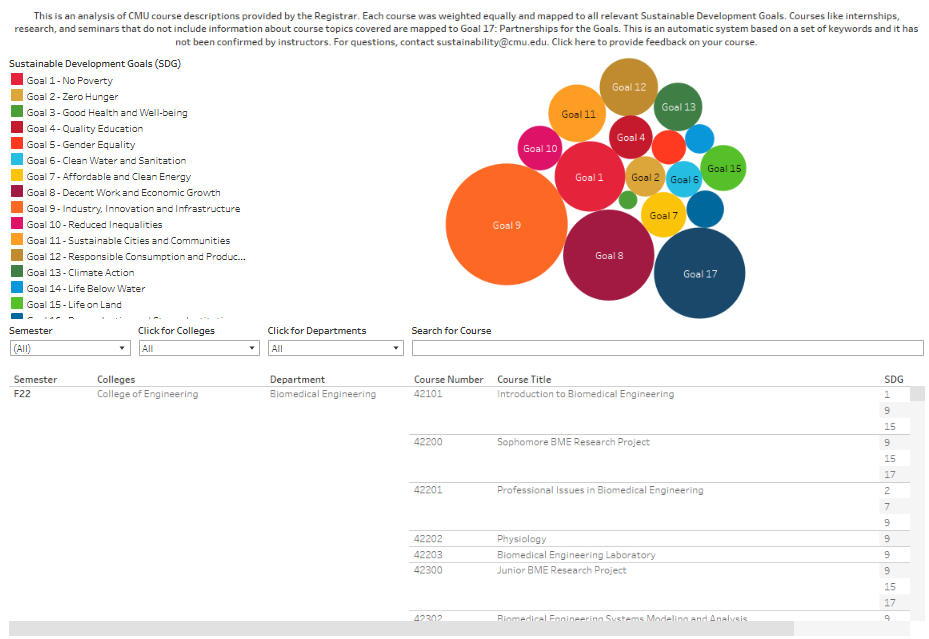
The analysis is based on course descriptions in S3. Courses like internships, research, and seminars that don’t include information about course topics covered are mapped to Goal 17: Partnerships for the Goals. This dashboard was created automatically based on a set of keywords and has not been confirmed by instructors.
Below is a screenshot of the Education dashboard. To access the Education dashboard, you must have an Andrew userID and be connected to the CMU virtual private network (VPN).
- On the left are all of the Global Goals listed in order. The right side shows a visualization with circles for each of the 17 Global Goals. The size of the circle represents the number of courses associated with each goal.
- Hovering over a circle will show the name of the goal, the number of courses associated with the goal, and the top department contributing to the goal.
- Clicking on the goal from the left panel or from the circle visualization allows you to filter the courses listed at the bottom by a specific goal. You can also click on the goal and exclude the courses associated with it from the list.
- The bottom of the dashboard allows you to filter courses through several dropdown menus including semester, college, department, or specific course.
This is a screenshot of the Education dashboard. To access the Education dashboard,
you must have an Andrew userID and be connected to the CMU virtual private network (VPN).
Research
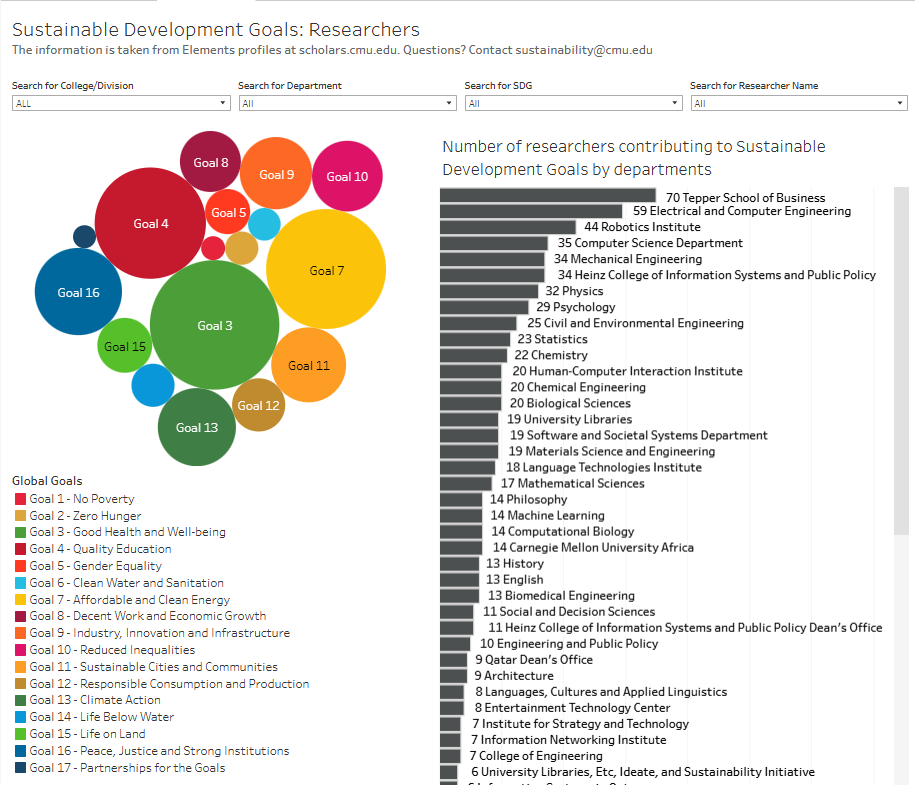
This information is taken from Elements profiles at CMU Scholars. Faculty members can edit their own profiles to reflect the Global Goals relevant to their research interests.
Below is a screenshot of the Research dashboard. To access the Research dashboard, you must have an Andrew userID and be connected to the CMU virtual private network (VPN).
-
- The left side shows a visualization with circles for each of the 17 Global Goals. The size of the circle represents the numbers of researchers associated with each goal.
- Hovering over a circle will show the name of the goal and the number of researchers associated with the goal.
- Below the circle visualization is a list of the Global Goals.
- Clicking on the goal from the circle visualization or from the list allows you to filter researchers listed on the bottom right by each goal. You can also click on the goal and exclude the courses associated with it from the list.
- The bar graph on the right side shows researchers by department. The color of each bar correlates to the goal to which the department contributes the most. By clicking on a department, the visualization of goals reorganizes to show how many researchers in the chosen department contribute to each goal. Goals that the department doesn't specifically contribute to are not shown.
- The list of researchers and their department name for the selected goal or department is shown on the bottom right of the screen. Selecting a researcher from the list reorganizes the visualization of goals to just the goals to which the researcher contributes.
- The top of the dashboard allows you to filter researchers through several dropdown menus, including college/division, department, and researcher name.
This is a screenshot of the Research dashboard. To access the Research dashboard,
you must have an Andrew userID and be connected to the CMU virtual private network (VPN).