|
Predicting Cognitive
Performance in Open-ended Dynamic Tasks | ||||||||||||||||||||
|
Menu
|
Human performance data for model calibration
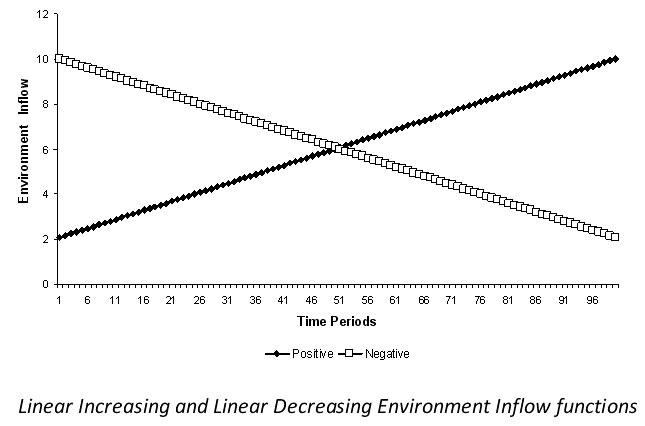
To help modelers calibrate their submissions, we provide two human data sets reported in Gonzalez & Dutt (2007) and Dutt & Gonzalez (2007). Each of the two human data sets belong to two experiments that vary the function of the Environmental Inflow as well as the slope of the function. In both of these experiments the Environmental Outflow function was constant and set to zero throughout 100 time periods. The main performance measure in DSF is the Goal Discrepancy: The difference between the goal and the stock amount in each time period. The optimal value is zero in Goal Discrepancy. The goal was to maintain the level of water in the tank within +/- 0.1 gallons from 4 gallons during all the 100 time periods. The initial water level in the tank was fixed in both conditions at 2 gallons. In the first data set, the Environment Inflow function was a Linear increasing or a Linear decreasing function (see figure). Environment Inflow increased or decreased over the course of 100 time periods using the formulas: 0.08 * (TimePeriod) + 2 for the increasing linear Environment Inflow function and -0.08 * (TimePeriod-1) + 10 for the decreasing linear Environment Inflow function. Both functions caused an equal amount of water to flow into the tank over the course of 100 time periods (which was 604 gallons).
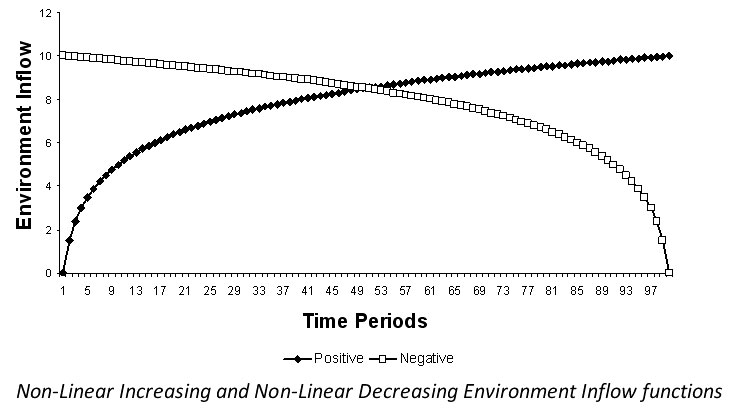
In the second data set the Environment Inflow function was a Non-Linear increasing or a Non-Linear decreasing function (see figure below). Environment Inflow increased or decreased over the course of 100 time periods using the formulas: 5*LOG (TimePeriod) and 5*LOG (101- TimePeriod). Both conditions had a total Environment net flow of 831 gallons over the course of 100 time periods.
The attached spreadsheets provide the raw subject data for each condition, including for each individual time period the following information, in order: form of environmental inflow function, subject id, time period (from 1 to 100), Environmental Inflow value (according to the function in that condition) and Environmental Outflow value (zero in all conditions), User Inflow value and User Outflow value, actual amount in the tank, and target goal. Download spreadsheet of human performance
data of linear conditions. |
|||||||||||||||||||