Navy Yard Building 101
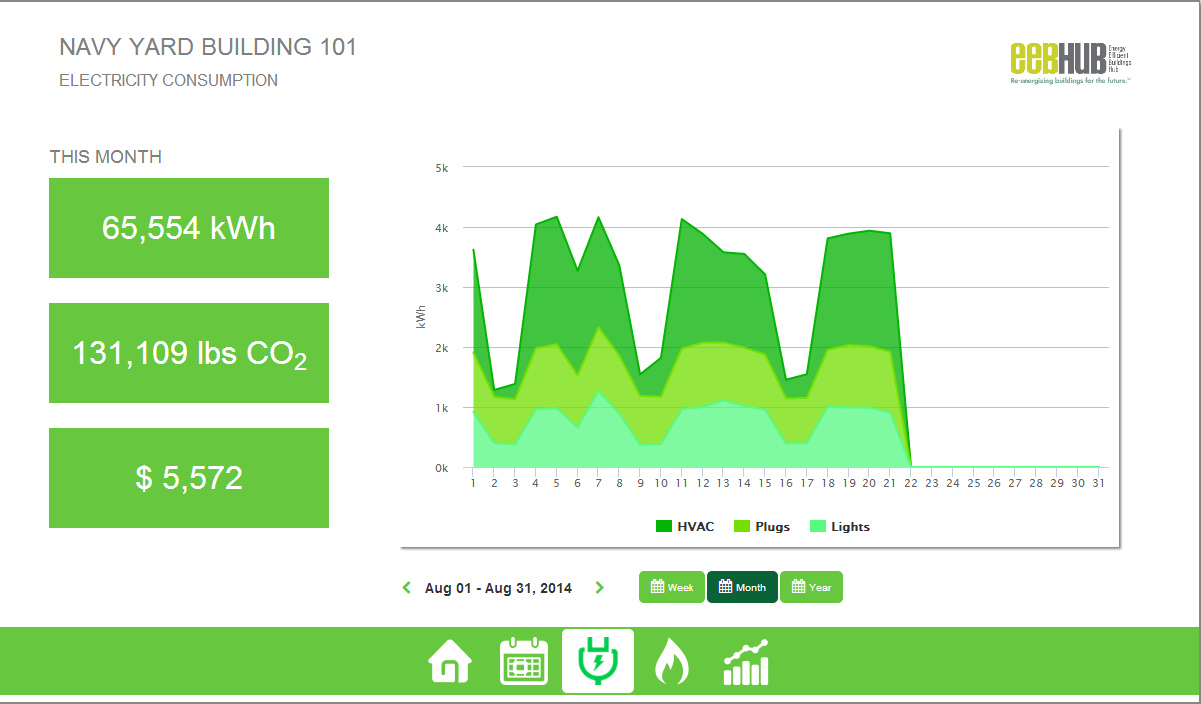
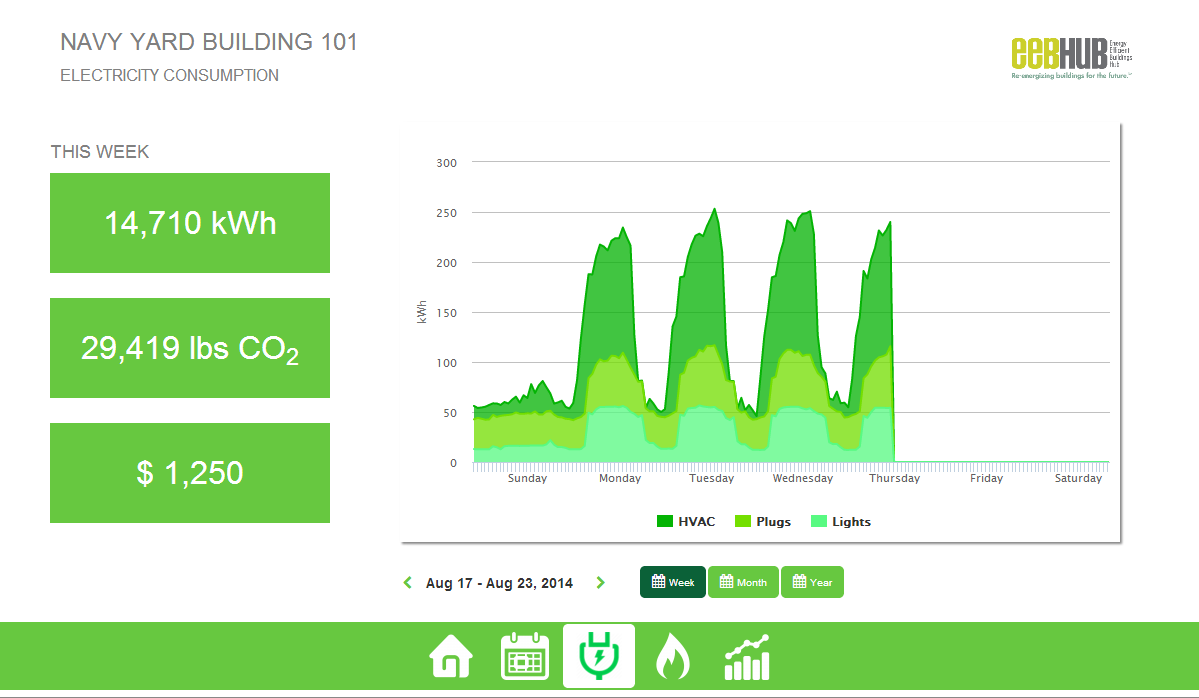
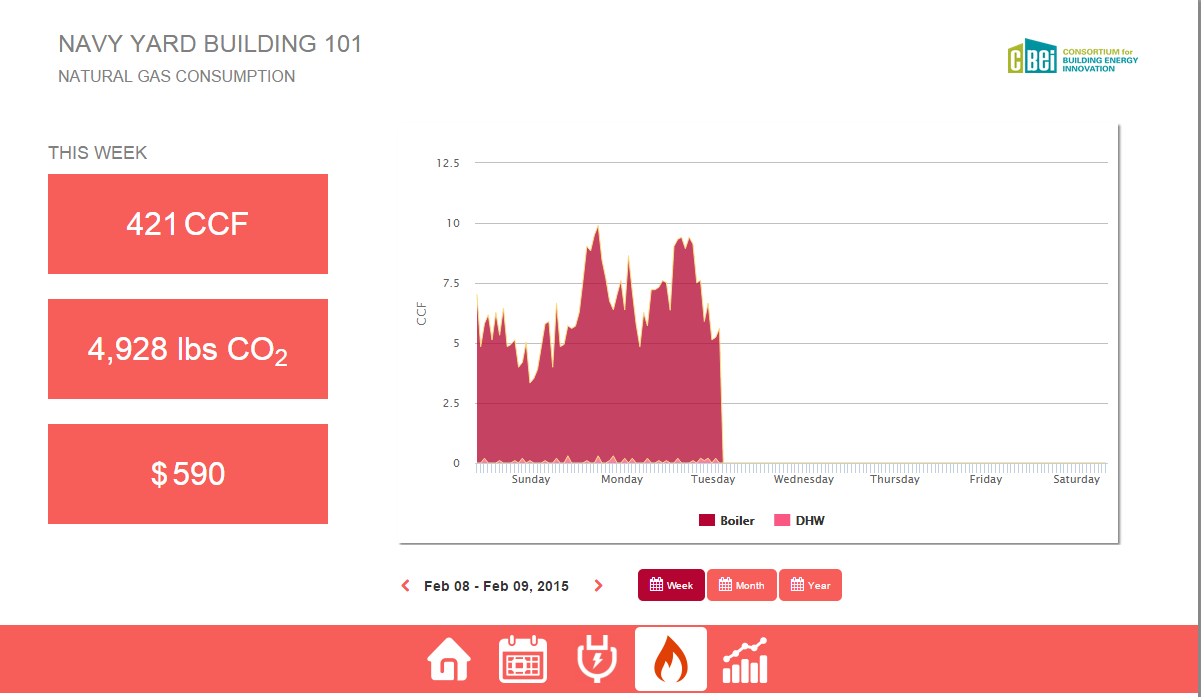
This web-based interface displays real-time and historic data from smart meters and sensors in Building 101.
Weekly, monthly and yearly views help occupants and the public identify trends and waste in electricity and gas use by end use.
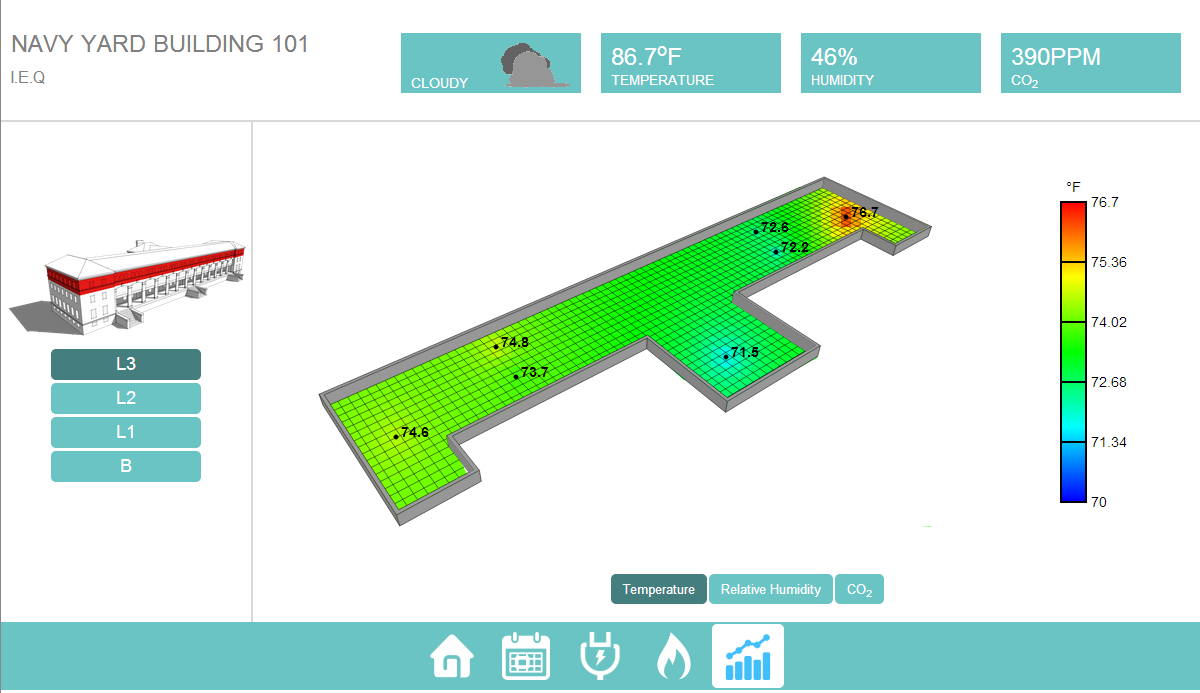
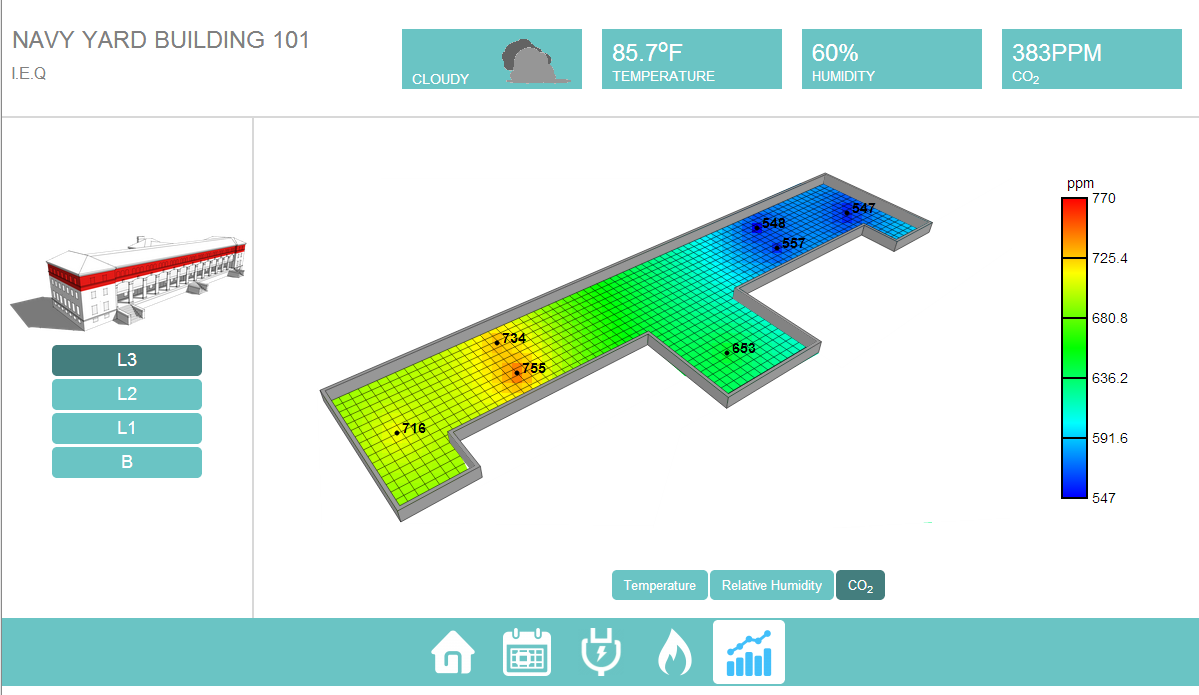
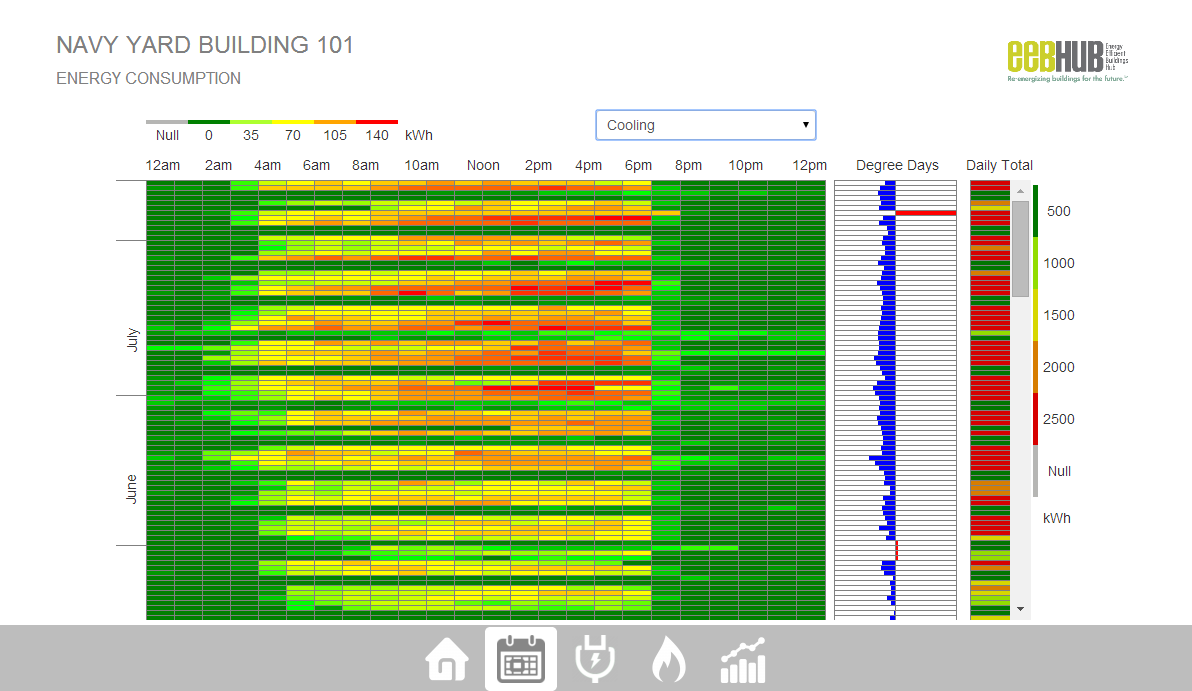
The indoor environmental quality maps the interior and exterior weather conditions, temperature, relative humidity and carbon dioxide at each sensor on the floor plan. The energy heat map displays the hourly consumption for various end uses for each day of the month, allowing the user to quickly identify waste during unoccupied hours.
View Website