Corporate and Campus (ID-C)
About Intelligent Dashboard for the City/Campus
In the ID-C (Intelligent Dashboard for City/Campus), policy makers and executives of corporations, governments or organizations are presented with actionable information about their portfolio of buildings based on monthly utility bills. With energy disclosure laws, various categories of buildings are required to disclose their utility bills, revealing potential areas of improvement. Corporations and organizations can use this information to make decisions to improve the energy efficiency of their portfolios.
The ID-E interface or report develops graphics to include information such as a summary of the organization’s utilit consumption to show a company energy profile, a list of the most inefficient buildings to target for retrofits, and the energy signatures of each to identify the potential type of retrofit.
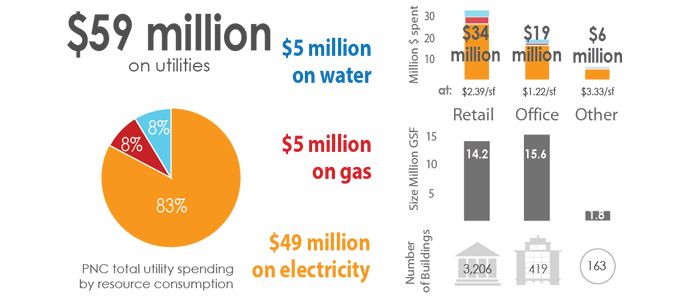
PNC
Corporate Portfolio with Monthly Utility Bills
A guide for visual representation and analysis of annual and monthly energy and water data to most effectively engage stakeholders at the executive level, with PNC Bank user focus group
View Project
Philadelphia Zoo
Campus with Monthly Utility Bills & BAS
A report of current Philadelphia Zoo energy use and sub-metering condition and utilities analysis guideline for existing zoos and aquariums.
View Project