Jeffrey C. Johnson
Department of Sociology, East Carolina University, johnsonje@mail.ecu.edu
Lothar Krempel
Max Planck Institute for the Study of Societies
Cologne, Germany, lk@mpi-fg-koeln.mpg.de
For optimal viewing, this article requires a Java-enabled browser and Adobe's SVG Viewer, http://www.adobe.com/svg/viewer/install/main.html
ABSTRACT: This paper explores the use of visualization
methods at two different levels of analytical detail (e.g., moving from a
time-independent aggregated view to a more detailed time series analysis)
of data derived from Reuters news tickers between September 11 and
November 15, 2001. This data comprises a large, complex set of related words
that presents an interesting analytical challenge. The relationships among words
in the news articles were extracted using Centering Resonance Analysis (CRA). In
this paper, we present two secondary analyses of the CRA networks. The first
analysis involves a two-dimensional layered grid approach using convex hulls for
examining the intersection and union of sets of words in the text in a two-dimensional
projection. Additional SVG versions of these images allow exploration of the solutions
interactively. The second approach involves the use of three-dimensional interactive
visualizations and centrality analysis using the molecular visualization program Mage. A
major guiding question of this work is the following: Can we gain knowledge
about the conflicts within and dynamics of the "Bush team" from a visual
exploration and analysis of the CRA data over the 66 days of the text? The
analysis of the news text using these approaches suggests that Powell has
played less of a role during the 66 days of the analysis then might be expected
given his formal status as chief foreign policy advisor to the President.
Introduction
The primary purpose of this article is to demonstrate the power of combined visualization and analysis in the study of complex networks. This work is based on a series of analyses and visualizations of data derived from Reuters news tickers between September 11 through November 15, 2001, presented at the 2002 International Sunbelt Social Network Conference in a session on network visualization. Participants in the panel received a set of networks extracted from the Reuters articles using Centering Resonance Analysis (CRA, Corman et al. 2002). CRA analyzes the discourse behaviors of authors and speakers to form a coherent message, and extracts from these a network of words: the position of a word in this network indicates its influence in producing a coherent message. The data comprises a large, complex set of related words that presents an interesting analytical challenge. In response to this challenge, we focus on the visualization and analysis of the portions of the CRA networks associated with the members of the White House inner circle -- the "Bush team." We show how structural network properties of Reuters stories over this two-month period may shed light on the inner workings of the team. Specifically, we address the following question: Can we understand anything about the conflicts within and dynamics of the Bush team from a visual exploration and analysis of the CRA data over the 66 days of the text as reported by Reuters?
The Problem
There are a number of recent examples in the news and other media sources reflecting possible divisions within the White House inner circle. For example, a New York Times article of January 28, 2002, entitled "Colin Powell Dissents" discussed disagreements between Powell and other team members in terms of the legal designation of Al Qaeda and Taliban prisoners. Even such Sunday entertainment supplements as Parade Magazine have alluded to the division between Secretary of State Powell and, in particular, Vice President Cheney, Secretary of Defense Rumsfeld, and National Security Advisor Rice. Disputes reported in the media between the Department of Defense and the State Department concerning Middle East policy provides further evidence of a possible rift in the Bush inner circle. Additionally, numerous humorists and cartoonists have used these inner circle dynamics as material for jokes and cartoon subject matter. The September 16, 2002, cover of Newsweek shows pictures of Rumsfeld and Powell with the text "Rumsfeld vs. Powell" in reference to disputes over the controversy surrounding the invasion of Iraq. In a sense this division between the two appears to represent an even deeper division in the administration itself. Rumsfeld referred to in the Newsweek article as "the big stud in town," who is worshipped by the White House, stands in stark contrast to the only moderate in the White House inner circle, Powell, who is one member of the team who consistently has stressed talk of diplomacy over talk of war.
The main question for this paper is: Can we understand anything about the conflicts within and dynamics of the Bush team from a visual exploration and analysis of the CRA data over the 66 days of the text? Further, are possible role conflicts evident in a visual analysis of the CRA networks? Such role conflicts are hypothesized to be reflected in comparisons of the structural characteristics of inner circle members (e.g., degree centrality) and the uniqueness and overlap in words coincidental to team member identifiers (Johnson et al. 2003a, Johnson et al. 2003b). Uniqueness of words associated with a team member are hypothesized to reflect the unique role or contributions of that actor within the administration. Conversely overlap of words among members, especially at the dyadic level, may reflect overlapping roles in the administration or may even reflect possible role conflicts.
Centering Resonance Analysis
CRA is a bundle of techniques which transforms the structure of natural occurring text into a semantic network (Corman et al. 2002). In a first step sentences are automatically unitized. In a second step CRA selects all noun-phrases from the sentence units in step one. These noun-phrases consist of a noun plus zero or more nouns and adjectives. In a third step the words that make up the noun-phrases are linked. Words are linked sequentially within units; if a phrase consists of more than one word all possible pairs of the words within the phrase are also linked. Compiling these links over all sentences in the text yields a graph (discussed below) describing all words contained in the noun-phrases of text and how these are linked. To compare texts of different authors or speakers, CRA proceeds by indexing the units of the graph and also the links between the units. CRA typically uses centrality scores for these weights. Comparing identical elements in two graphs that represent different texts allows one to compute their "resonance," which is high when identical words in both texts have similar centrality.
The Data
The overall CRA data was derived from Reuters news tickers relevant to the 9/11 attacks. They were collected over 66 days starting the morning of 9/11, and participants in the Sunbelt panel received one CRA network for each day. This data was derived from data originally produced and analyzed by Dooley and Corman (2002), who describe its production more completely. We began by compiling a graph of the union of these 66 CRA networks. It contains more than 13000 words and more than 120000 links.
The first part of the paper focuses on a two-mode matrix extracted from this graph, which identifies all words that are directly connected to at least one of the nine Bush team members in the 66 days following 9/11. The resulting sub-graph describes how strongly each of the team members is connected to any of the 1444 words that are directly linked with at least one member of the team. Ā The players included in this analysis are President George W. Bush, Secretary of State Colin Powell, Secretary of Defense Donald Rumsfeld, Attorney General John Ashcroft, Vice President Richard B. Cheney, Chief of Staff Andrew H. Card Jr., Director of Homeland Security Tom Ridge, National Security Advisor Condoleezza Rice, and Deputy Secretary of Defense Paul Wolfowitz.
In the second part of this paper we analyze the same information but decompose the overall matrix into 66 n x m matrices, reflecting the network of relations among words and the eight team members (excluding Bush) at 66 points in time. Here the Bush connections are minimized for the sake of simplicity.
Analysis I: Global Patterns among the Bush Team Members
We want as complete a picture of the data as possible. We seek to identify unique domains to which single members are connected, and the degree to which domains in the team overlap. We see such unique domains as possible indicators of unique roles in the administration.
Layout: A Layered Grid Approach
One way to achieve a simplified drawing of the aggregated data set is to use and optimize a layered grid layout (with Pajek):
- The team members are assigned to the top layer, while all other nodes of the network (the words) are assigned to the lower layer.
- A grid structure is used to constrain the position of the nodes on both layers. A specific position of each layer can only be assigned to a single node.
- Optimizing the placements of the nodes for line length orders both layers simultaneously; the positions in each layer are exchanged until all links in and between the layers become minimal.
The result of this procedure is a three-dimensional layout. The ordering of this layout can be inspected with the help of additional graphical tools. Node sizes and color-schemes allow us to better explore the properties of network diagrams. A more systematic treatment of these problems can be found in Krempel (2002).
Exploring Ordered Sets with Hulls and Pies
In this paper we use convex hulls (O'Rourke 1994, Sedgewick 1988) to describe the overall logic of the grid layouts by identifying the locations of uniquely linked nodes and using partitions based on degree and centrality. The convex hulls of specific node-sets allow for the inspection of how certain properties are reflected by the spatial positions in a drawing. Since convex hulls characterize the complete set of elements of a certain type, they are very robust means for detecting order in network drawings.
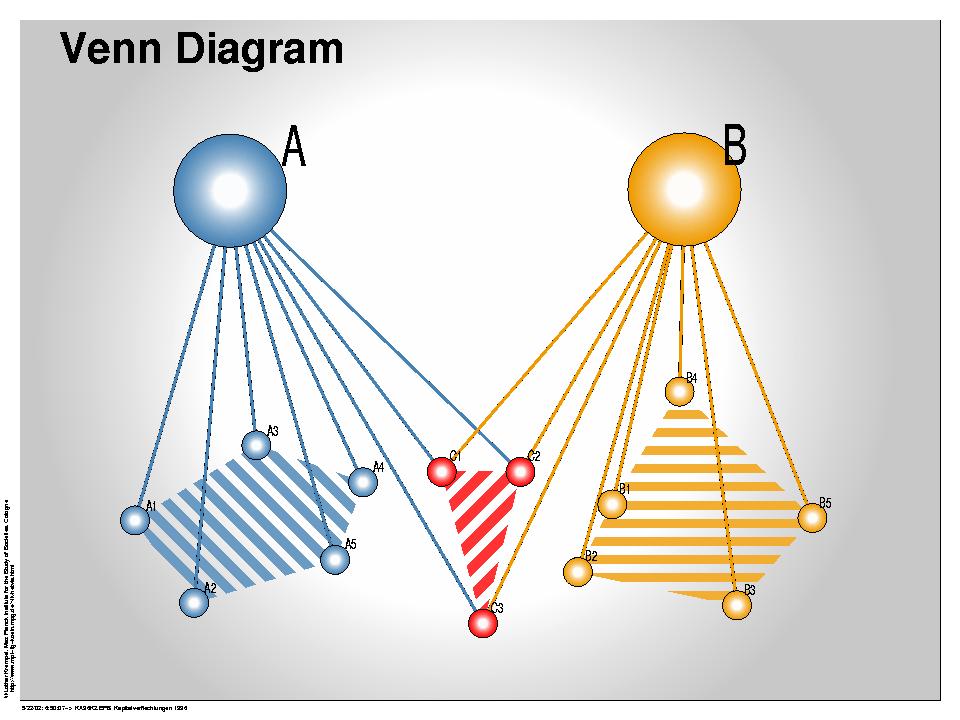
"The mathematical way to describe the natural boundary of a point set depends on the geometric property called convexity... A convex polygon has the property that any line connecting any two points inside the polygon must it self lie entirely inside the polygon... The convex hull of a set of points in the plane is defined to be the smallest convex polygon containing them all. Equivalently, the convex hull is the shortest path surrounding the points." [Sedgewick 1988: 359]The size of the hulls and their exclusiveness allows for inspection of the degree to which given set classifications is represented in a given layout. In Figure 1, a number of nodes on the lower level are connected to both elements A and B at the higher level. The hulls (hatched areas) of the three sets at the bottom can now be interpreted as Venn or Euler Diagrams in terms of nodes that are exclusively connected to A, nodes exclusively connected to B, and nodes that are simultaneously connected to A and B. In this case, red identifies the intersection of A and B.
Figure 1. Lower and higher level
connections as a Venn or Euler Diagram.
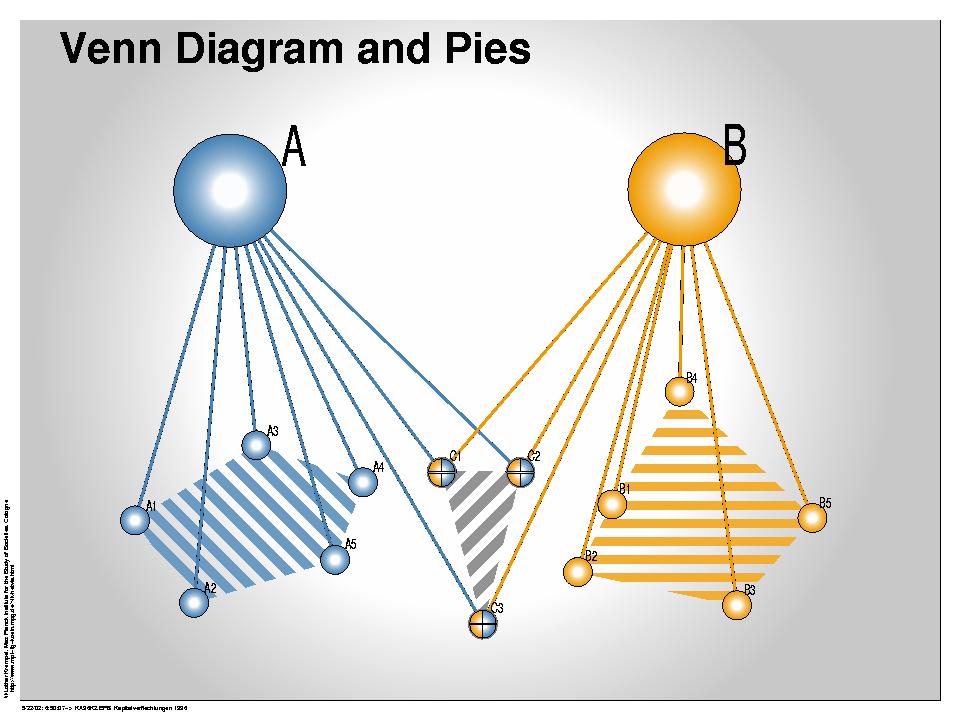
The same information can be
represented with pie charts on the lower level, as shown in Figure 2. In this case, nodes that are exclusively
connected to one of the members
of the second set are shown in the color of the node of the
top layer. The pies of the nodes
that are connected to both members of the top layer contain the colors of
both nodes.
Figure 2. Lower and higher level
connections as a Venn or Euler Diagram with the incorporation of pie charts.
Exploring the Layered Solution of the Bush Team
The two-mode graph for the Bush team contains nine members placed at the top layer and 1444 words connected to at least one of the nine team members at the bottom layer (thus reducing considerably the number of words). We use a top view on both layers, so that the solution can be inspected with a single 2D image; the team members are represented by their names, while the words are shown with pie symbols.
To explore the layout at the lower level we use nine different hues, each of which stands for one of the team members. The symbols that represent the different words of the news tickers are shown with the hues of those team members to which they are linked. Counting the number of hues of a given word symbol thus informs us of its (binary) degree.
Degree Sets
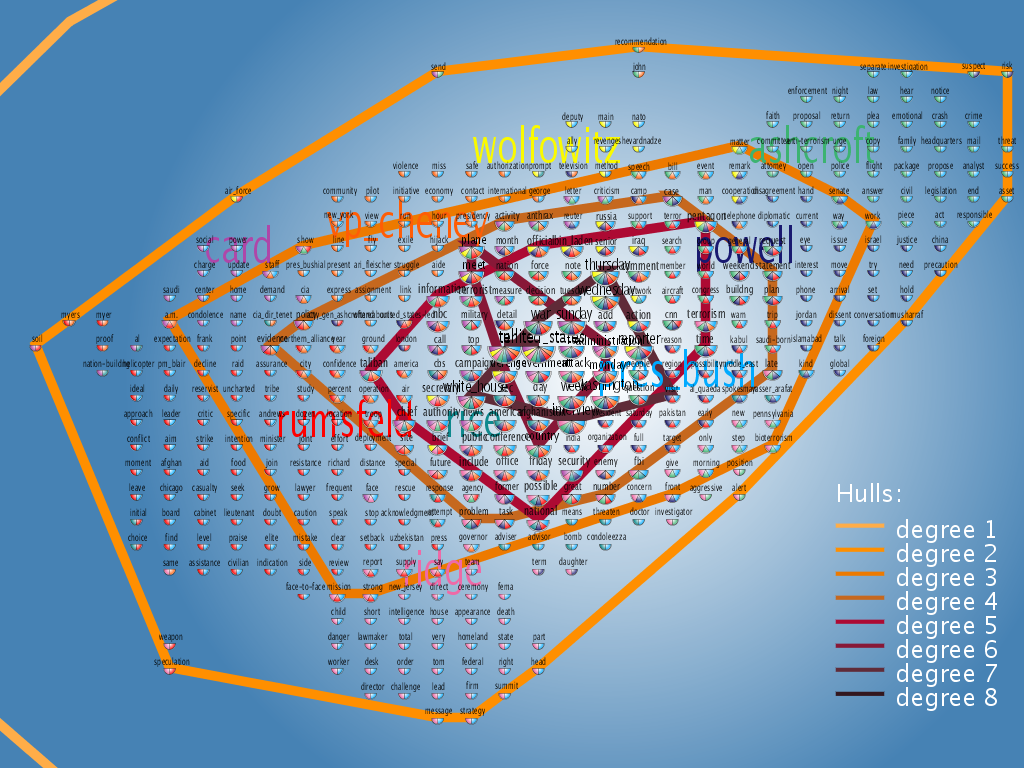
For a first orientation we classify all words by their degree. This facilitates the differentiation of the nine degree-sets; nodes that are exclusively linked to only one of the team members have degree one, whereas words that are linked to several team members have a higher degree. The underlying logic of the node layout that results from optimizing the layered grids, becomes clear if we use convex hulls to mark the outer boundaries of the nine degree sets; the more intense the color of these hulls, the higher the degree. As can be seen in Figure 3, the hulls are nested where words with higher degree are concentrated in the center of the drawing. This information can in principle also be read by counting the number of hues of the symbols or by looking at the relative size of the symbols which corresponds to their nodal degree. This figure identifies the convex hulls of the nine degree sets. The hulls of the sets with higher degrees are shown in more saturated colors and hulls are nested by degree.
Figure 3. Degree hulls. Click here [binary1.html] to explore the image interactively.
Word Sets Connected with the Team Members
A second inspection of the positions in the aggregated data again uses convex hulls but unlike the first approach it is used to identify which words are connected to each of the team members. This facilitates our ability to explore whether the placement of the nodes has any systematic relationship to the positions at the top layer.
Pie charts allow further exploration of the intersections of the convex hulls since they allow one to read which of the words each of the nine members is connected. Additionally we can characterize the size of the word symbols by their binary degree; words linked to one of the team members have the smallest size and have a degree of one while words linked to all of the team members are bigger and have degree nine.
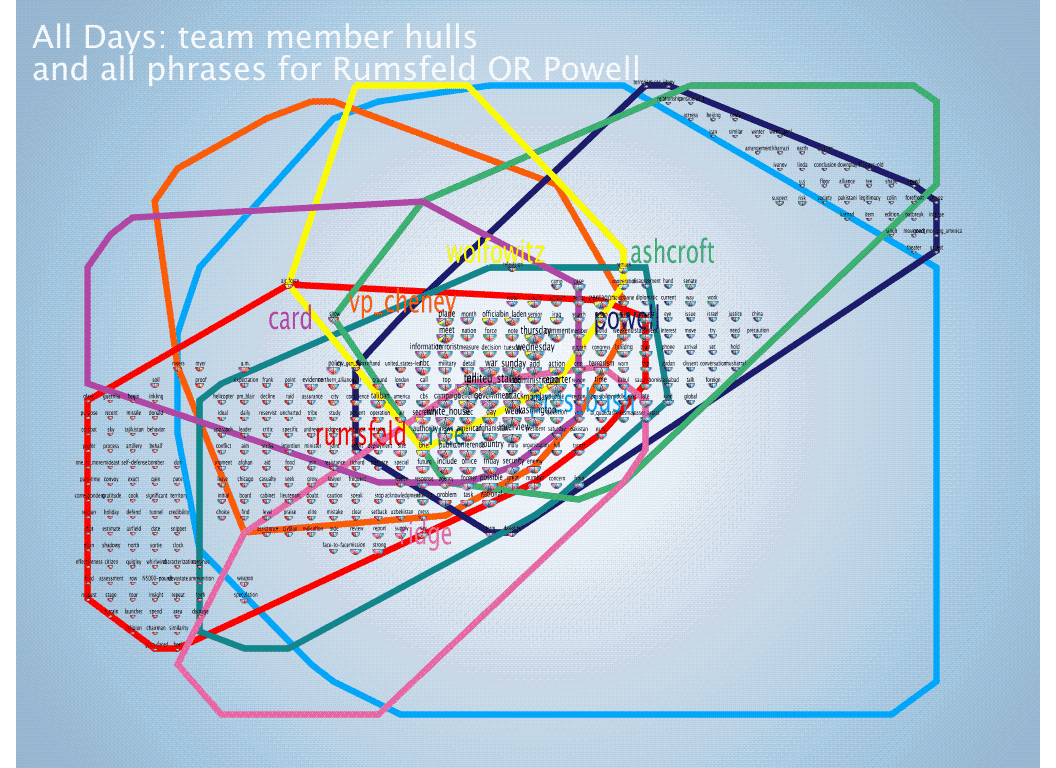
In Figure 4 we use pies and hulls to identify all word items that are connected to both Rumsfeld or Powell. All items in the lower left of the red hull identify words which are exclusively associated with Rumsfeld. Similarly, all items in the upper right of the dark blue hull are words which are exclusively associated with Powell. All words of higher degree that are simultaneously connected to both Rumsfeld and Powell can be found in the center (the intersection) of the hulls. All nodes that have more hues than red and blue are simultaneously connected to other members of the Bush team. The number of nodal hues informs us that these words are not exclusively connected to these two team members, but are connected to additional members as well.
Figure 4. Team hulls and words directly connected to Rumsfeld OR
Powell. Click here [RumPowOR.html] to explore the image
interactively and use [RumPowAND.html] to study the set
of words to which both are connected.
The remaining
words are associated with days of the week, places (e.g., Washington) or
institutions (e.g., White House) that describe nonspecific or commonly used
attributes in news reports. Thus CRA finds not only meaningful centers but
also identifies the common or typical settings of the reported activities.
For example, most news articles refer to the day of the week in which the
article was published or the day of the week in which a press conference
was given.
The analytical focus of CRA is typically oriented to the most
central elements of the graph, which represents words with high "connecting power"
in the text. The similarities and differences, how different actors are connected to
central words, are one form of information that helps in understanding potential role similarityĀ
in a given set of documents. As we set out to understand the inner workings
of the Bush team we are also interested to learn about the relative autonomy
of members. A closer look at words of different centrality might therefore
provide additional information for understanding such roles.Ā
In order to analyze whether similarities and differences in the
roles of the team members are
exclusively generated by words of high degree or constitute exclusive pair-wise,
triple or quadruple co-occurrences of words, we decompose the matrix of word
co-occurrences for the whole graph into separate matrices, each matrix containing
words of a given degree. Since
the number of words that are
exclusively connected to only one of the team members is a crude measure for the autonomy
of the roles in the Bush team, we start with a summary table. It describes
the number of words to which each of the team members is exclusively connected,
and how many connections he/she has to other members of the team
(summarized by the distribution of degree). Table 1 below gives the
absolute numbers, how many words are exclusively connected to each of the
team members, and the distribution of connections at higher levels of degree.
Bush Cheney Rumsfeld Powell Rice Ashcroft Ridge Wolfowitz Card unique
731 39
74
42
12
48
28
7 42
degree
2 217 37 80
33
14
47
41
9 14 degree
3 79 23 50 31
6 31 17 4 8 degree
4 36 15
31
19
6 23
11
4 11 degree
5 29 19
26
21
12
10
13
5 10 degree
6 9 7 8 7 2 7 6 3 5 degree
7 9 9 10
9 10
10
6 3 4 degree
8 0 0 0 0 0 0 0 0 0 degree
9 2 2 2 2 2 2 2 2 2
Role
similarities between the team members are based on the number of jointly
shared words. The similarities between all members of the team are created
mainly through a small number of high degree words. The table below gives
the specific words for degree 5 and higher. As mentioned before only some
of them are meaningful for understanding these roles. Many higher level words
describe the setting, temporal attributes and institutions.
Degree words
with degree > 4 degree
5 bin_laden, official, action, pentagon, secretary,
nbc, office, public, national, possible, conference, terrorism, degree
6 afghanistan, american, day, sec, comment, time,
friday, include, attack, monday, country, defense, fox, administration,
government, meet, plane degree
7 Interview, washington, week, thursday, wednesday,
reporter, sunday, war, white_house, pres_bush degree
8 - degree
9 united_states, tell
degree
two Bush Cheney Rumsfeld Powell Rice Ashcroft Ridge Wolfo Card Bush 0 29 69 26 7 37 32 7 10 Cheney 29 0 3 1 1 2 1 0 0 Rumsfeld 69 3 0 2 2 0 2 1 1 Powell 26 1 2 0 0 2 2 0 0 Rice 7 1 2 0 0 1 0 1 2 Ashcroft 37 2 0 2 1 0 4 0 1 Ridge 32 1 2 2 0 4 0 0 0 Wolfow 7 0 1 0 1 0 0 0 0 Card 10 0 1 0 2 1 0 0 0
degree
four Bush Cheney Rumsfeld Powell Rice Ashcroft Ridge Wolfo Card Bush 0 21 46 30 6 29 16 4 6 Cheney 21 0 13 4 0 4 1 0 3 Rumsfeld 46 13 0 17 2 14 6 0 2 Powell 30 4 17 0 3 3 2 2 1 Rice 6 0 2 3 0 0 0 1 0 Ashcroft 29 4 14 3 0 0 8 1 3 Ridge 16 1 6 2 0 8 0 0 1 Wolfow 4 0 0 2 1 1 0 0 0 Card 6 3 2 1 0 3 1 0 0
In this part
of the analysis we have explored the overall aggregated network of words,
which summarizes the events after September 11. The subset of the complete network we have used so far contains
all the words that are directly connected to any of the members of the Bush team. We have used a layered grid
approach to arrange the nodes of this graph. Assigning actors and words
to different layers, and optimizing this arrangement for line length, orders the positions of the words
and team members simultaneously. The resulting optimized grid layouts reveal
many systematic properties. To access these, we have made use of convex
hulls and hues that help to identify how certain node sets are positioned
in the layout. Adjacent positions of same-colored items identify the
connectedness of single team members to certain types of words. Using pie symbols
for the words answers two questions: which of the actors is connected with
which words, and words of which degree, when the sizes of the pies are
used as symbols for nodal degree.
Identifying
different roles in the Bush team from the time-aggregated CRA graph of the
news ticker items leads to the following conclusions. President Bush is not
only exclusively connected to a very large number of words in Reuters
news ticker, but he is also the dominating center for most of the words
that connect any of the team members. This is especially true for all words
that connect any two members of the team. Whenever a team member is connected
to such a low degree word, it is connected to the President. Despite a
functional differentiation of tasks and responsibilities, the dominating pattern
in Reuters news is that of a team that is highly coordinated through President
Bush.
Some indication
of role differentiation in the team can be found when one looks for overlap
in the words that have a higher degree (words that are connected to several
team members). Here we find Rumsfeld, Ashcroft, Ridge and Cheney more closely
tied together than other members of the team. Rumsfeld plays a more central
role than Powell. Looking at the same data from the perspective of frequency
of links by using the weighted degree (counting also how often a certain
word is connected with the same actors), we can further identify meaningful
word centers of high degree that are exclusively tied to Rumsfeld or Powell.
Whether these findings represent more than a functional division of roles
between a Secretary of Defense and a Secretary of State, however, canĀnot
be decided on the basis of the time aggregated dataset alone. Nonetheless,
there is no question that the reporting on military actions in Reuters news
outweighs the reports on international political initiatives that are connected
to the Secretary of State.
In the following series of
analyses we examine the relationship among team members and words across
all 66 time periods. However, as was the case in the previous analysis, Bush is so
dominant in the network that he obscures the view of the possible roles of
the remaining players, particularly Rumsfeld and Powell. Thus we drop Bush
from the analysis and concentrate on the remaining eight team members.
There are three primary types of matrices that will be analyzed in this section.
The first is a 988 x 988 matrix containing the relations among the 988 words
that have a connection to at least one team member (the n x m matrices described
earlier were transformed into a series of n x n symmetrical matrices). The
second includes two sets of 2-mode matrices (8 x 66 and 8 x 56) that provide
information on the degree and betweenness centralities, in terms of connections
to words, of the eight members over both a 66- and a 56-day time period. Finally,
a series of 6 n x n word matrix time slices are explored at critical points
in the 66 day time period (e.g., at the beginning of the air campaign, at
the beginning of ground offensive).
The first set of analyses involves an
examination of degree and betweenness profiles for the eight team members over
the 66 days of the Reuters news tickers. This is followed by a multidimensional
time-series correspondence analysis (Greenacre 1984: 267) of both centrality measures
over-time. Finally, several interrupted time series analyses examine 3D visualizations
of aggregate and selected time slices, using kinemages as viewed in Mage. A "kinemage" (kinetic image) is an authored
illustration presented as an interactive computer display (Richardson
and Richardson 1992). Although
originally developed for visualizing biological molecules, kinemage format
and display are content-neutral, making
it useful in other fields as well, such as for studying social, semantic,
and ecological networks (Johnson, Richardson, and Richardson 2002; Johnson
et al. 2001; Freeman 2000; Freeman, Webster, and Kirke 1998).
Centrality Profiles Over Time
The purpose of this centrality
(Freeman 1979) analysis concerns a visual examination of the dominance and importance
of the eight team members in terms of their connections to words in news reports
over the 66 days. Figure 6 provides a series of graphs showing
the betweenness centralities for each of the eight team members over the 66 days
of reporting. As is evident from the graphs, structural connections to words
in the first few days following the attacks on the WTC and Pentagon overwhelm
an understanding of centralities over most of the 66 days possibly reflecting
a flurry of activity by a wide range of White House staff. Cheney, Powell,
Ashcroft, Rumsfeld, and Card all display high levels of betweenness centrality
in the first few days following the attacks.
In an
interactive examination of Figure 10, it is instructive to click off the ties
between time periods (click on the "Ties" check box on the right) in order
to better view both the relationships among team members in terms of profile
similarities and the relationship between members and the various days (it
is also helpful to rotate the kinemage in order to discover different views
of the three-dimensional relation among team members and days). As would be expected
from the betweenness profile analysis above, both Powell and Rice are very
near one another in space. There are four "arms" in the three-dimensional space,
each being related to one or more team members. Of course Powell and Rice
represent one such arm with their shared relationship to days around 14-15,
34, 41, 47 and 63. Cheney represents another arm with his strong identification
to day 43, while both Card and Ridge reflect the two remaining arms in space.
Card is associated with days 44 and 48 and to some degree day 20. Ridge is
associated with a series of days including days 40-42, 28, 46, 36, 39, and
58. Ashcroft has patterns similar to Rice and Powell although at a much weaker
level (Ashcroft and Powell, r = 0.33, p<0.01; Ashcroft and Rice, r = 0.34,
p<0.01). Wolfowitz is found near day 66, which is the only detectable
day in which he had a betweenness score greater than zero. Finally, Rumsfeld,
clearly the most dominant member of the team in terms of betweenness centrality,
is found at the intersection of all four arms reflecting his dominance in
this measure of centrality across the 56 days.
 ĀĀ Ā
ĀĀ Ā
Since the placement algorithm worked on the valued version of the two-mode
graph, the placement of the nodes also reflects how often a word is linked to each of
the team members. This yields additional information since specific team members can be
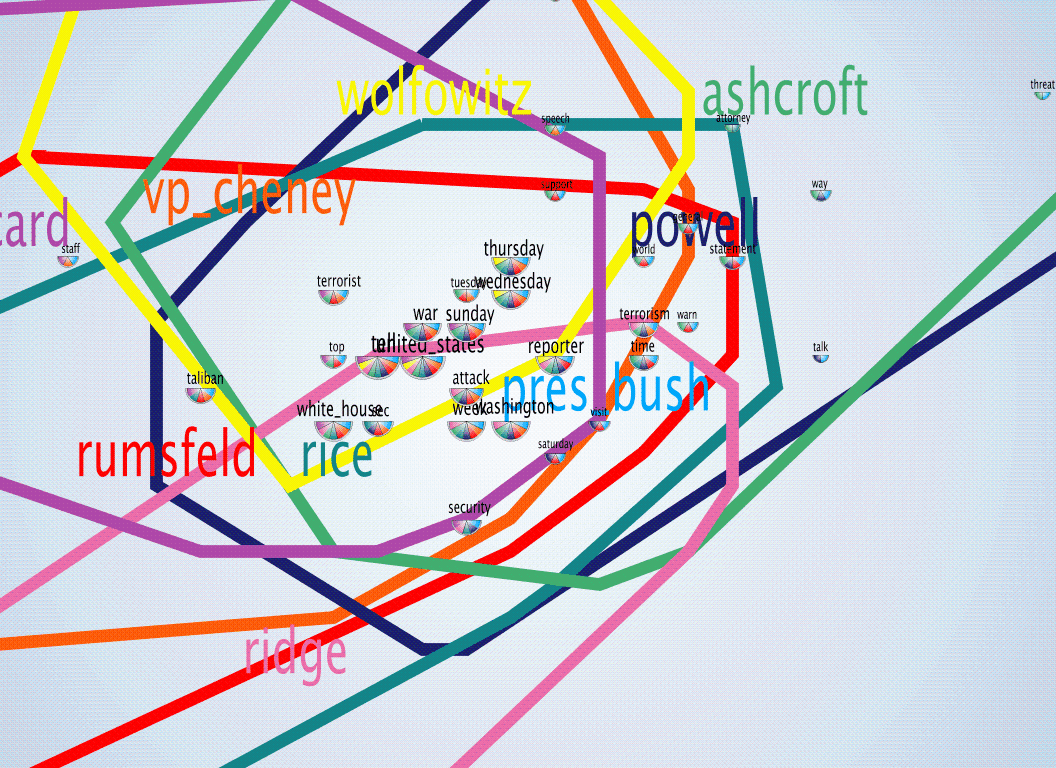
linked by more than one word. If we select the words by their weighted degree as is shown
in Figure 5; we get the most central words which are not only highly connected to team members
but are also more frequently connected. This leads to some interesting observations.
The words United States, attack, war, terrorism,
security, terrorist and taliban identify the meaningful
core of the text-centers that connect many of the team members. For example,Ā
the words terrorist (card, rice, rumsfeld, vp_cheney, pres_bush),
taliban (card, rice, rumsfeld, vp_cheney, pres_bush) are not (directly)
connected to Powell but are to Rumsfeld. On the other hand, security
and terrorism are two words with no connection to Rumsfeld but to
Powell.
Figure 5. All words having degree higher than 15. For interactive svg versions of this image click [weighted.html]. The image [weightednb.html]
also shows the frequencies with which team members are connected.
Roles and Role Similarity and Autonomy
Table 1. Exclusively
connected words and number of words by degree connected to each of the team
members.
The overall distribution in Table 1 is strongly skewed; most of
the words are exclusively connected to single team members, only a few of
the links that connect to team members occur via words that have degree
5 or higher. Counting the number of exclusively connected words, which
we interpret as a measure of ascribed autonomy in the news texts, it is clearly
evident, that President Bush is the most dominant actor in Reuters News. He
is exclusively connected to 731 out of 1444 words that define the complete
graph; more than 50 percent of all words are connected only to him and to nobody
else. The rank-order of autonomy starts with Pres. Bush (1) followed by Rumsfeld
(2), Ashcroft (3), Card (4), Powell (5), Cheney(6), Ridge (7), Rice (8)
and Wolfowitz (9).
Table 2. Words with degree greater than 4.
At
the level of exclusive dyadic connectedness only those words that
have degree 2 (i.e. words that are linked to exactly two actors and never
occur with any of the remaining others) are used. As can be read from Table 3, such
pair-wise exclusive word sets connect almost all of the team members with
President Bush only. In the news analysis we find no direct overlap between
the team members themselves; there are only very few words of degree 2 that
connect any other pairs of the team.
Table 3. Co-occurrences for words of degree 2.
While
the corresponding matrix for words of degree 3 looks very similar to that of degree 2, the co-occurrence matrix for words of degree 4 (Table
3) exhibits more structure. Even here President Bush is connected with most
of the words and is especially connected to Rumsfeld (46). These words
connect four members of the team each. The almost empty sub-matrix between
the other team members however becomes more populated; 17 links are induced
between Rumsfeld and Powell . Whereas Rumsfeld shares 14 links with Ashcroft, 13 links with Vice President Cheney and 8 links with Ridge. The number
of shared words between Powell and Ashcroft, however, is only 3; between
Powell and Cheney no more than 4; and with Ridge 2. Finally there
are 8 words that connect Ashcroft and Ridge.
Table 4. Co-occurrences for words of degree 4.
Summary of Analysis I
Analysis II: Changes Over Time
Figure 6. Betweenness profile by ego after initial attack on the WTC and Pentagon.
To better understand centrality
profiles over this time period, Figure 7 provides a series of graphs showing
betweenness centralities following the initial news reporting on the attacks,
more specifically after day 10. This series of graphs reveals a clear domination
by Rumsfeld in terms of betweenness centrality over the 56 days of the analysis.
Another interesting feature of these graphs is the apparent similarity in
betweenness profiles over this time period between Powell and Rice. Figure
8 provides a direct comparison of betweenness profiles showing a striking
degree of similarity between Powell and Rice over the 56 days (r = 0.86,
p<0.0001). This stands in contrast to a comparison of Powell and Rumsfeld
(Figure 9) who are somewhat out of sync with one another (r = -0.18, p<
0.2), particularly between days 32-33.
Figure 7. Betweenness profile by ego after day 10.
Figure 8. Comparison of betweenness profiles after day 10 for Powell and Rice (r = 0.86, p<0.0001).
Figure 9. Comparison of betweenness profiles after day 10 for Powell and Rumsfeld (r = -0.18, p<0.2).
This
similarity between Powell and Rice is further illustrated from a multidimensional time-series
correspondence analysis (CA) of the betweenness profiles of the eight team members over the
56 days of reporting. Figure 10 is a three-dimensional kinemage of the CA of betweenness
centralities after day 10. The red nodes represent team members while blue balls
represent each of the 56 time periods. Vectors linking days are directed and move
from day 10 through day 66. The vectors linking days were included to explore
possible patterns across time periods. The points in space can be rotated by left
clicking in the kinemage and then left clicking in the space and moving the mouse in the
desired direction of rotation. The letter ?t? can be hit to reduce or increase line thickness
for better clarity.
Figure 10. Kinemage 1: Correspondence analysis of the betweenness centralities by time after day 10. Kinemage can be explored by placing curser in black space, left-clicking and rotating
the mouse in the desired direction of rotation.
Similar
to the betweenness centrality analysis above, we now turn to an analysis
of degree centrality. Figure 11 shows the degree centrality of the eight team
members over the 66-day time periods. Powell is by far the most central member
within the initial 10 days following the attack, but this dominance diminishes
after day 10. Again Rumsfeld is the most dominant member of the team following
day 10, with Ridge being of importance between days 35 and 60. This is reasonable
considering his post as Head of Homeland Security was not established until
some time after the attacks. In keeping with the previous analysis on betweenness
centrality, Figures 12 and 13 show the comparison in degree profiles between
Powell and both Rice and Rumsfeld after day 10. Rice and Powell have a significant
similarity in degree profiles over the 56-day period, but not to the same
extent as betweenness centrality (r = 0.47, p <0.0001), and Powell and
Rumsfeld have an almost inverse relationship (r = -0.23, p< 0.09).
Figure 11. Degree profile by ego.
Figure 12. Comparison of degree profiles after day 10 for Powell and Rice (r = 0.47, p<0.0001).
Figure 13. Comparison of degree profiles after day 10 for Powell and Rumsfeld.
Figure 14 is a kinemage of
a correspondence analysis of the degree centrality of the eight
members over all 66 days of reporting. Clicking off the "Ties" again reveals the relationships between team members and days in terms
of degree profiles. The structure of the CA is similar to that found in Figure 10 in terms of the various ?arms? in the three-dimensional
space, although such arms are not
as well structured and clear. Similarly, Rumsfeld is in
the center of the space revealing his dominance in degree centrality
over most of the 66 days of reporting. Clicking off the check box next to
"Times" provides a clearer view of the spatial proximities among the eight members of the team with respect
to degree profiles.
Figure 14. Kinemage 2: Correspondence analysis of the degree centralities by time. Kinemage can be explored by placing curser in black space, left-clicking and rotating
the mouse in the desired direction of rotation.
Interrupted Time Series: 3D Visualizations of Aggregate and Selected Time Slices Using Mage
We now turn to a visual examination of the aggregate network and a series of networks at important time points within the 66 days of reporting. The following kinemages are meant to explore the nature of words connected to each of the eight team members that will help in understanding team member roles and shared relations to words. In addition, the manner in which the kinemages are constructed is meant to show the power of Mage in allowing for the simplification of rather complex network visualizations through Mage?s ability to interactively rotate the graph and turn on and off categories of nodes, arcs and node/arc sets.
In an attempt to facilitate the simplification of networks in this section, particularly the aggregate network (all 66 days), the words in the total data set were classified into categories deemed important to the analysis. The words were coded into one of six categories. The first and most obvious of these are the "Egos" themselves which include each of the eight team members. The second category includes all other remaining proper names (with the exception of first names only), which is referred to as "Actors." These include such names as musharraf, arafat, ari_fleischer, etc. The third category includes all words that refer to formal roles, ranks, and statuses and is referenced as "Roles." These include words such as commissioner, investigator, undersecretary, general, governor, etc. The fourth category of terms involves words representing both organizations and nations and is termed "Orgs/Nat" or sometimes simply "Orgs." This category encompasses words like postal-services, aclu, navy, iran, china, pakistan, etc. The final category is called "Terms" and includes all remaining words not classified within the previous five categories. Although the "Terms" category, the largest of the six, could have been broken down further into a number of possible other categories, it is important to note that large numbers of category sets makes the dyadic comparison of links both within and between sets increasingly more complex as numbers increase (both visually and practically).
Aggregate Analysis
Figure 15 is a kinemage of the relations among all 988 words linked to at least one of the eight team members over the 66 days of reports. Three-dimensional coordinates were obtained with the use of a spring embedder (Fruchterman-Reingold) found in Pajek (Batagelj and Mrvar 2002). An examination of the kinemage reveals a rather complex network of relations among words. However, the graph can be readily simplified and explored progressively by removing and then replacing categories of both arcs and nodes. Along the right side of the kinemage are various boxes that will turn on and off entire node categories, nodes, and or node labels. In addition, all arcs ("Ties") or specific arc sets (e.g., EGOS <-> EGOS, ACTORS<->EGOS) can be turned on and off. One way to simplify and explore the graph involves clicking off all arc sets under the "Ties" box. Next, turn off each of the categories with the exception of "EGOS" by left-clicking on each of the category boxes. This will leave only the eight team members in three-dimensional space, and they can be rotated for inspection. Links between team members can be observed by clicking on the arc set representing "EGOS<->EGOS" ties. At this point, categories can be progressively added and removed in order to explore the overlap and uniqueness of words within categories that are associated with each of the eight team members. For example, by clicking on the "ACTORS" box and subsequently clicking on the "ACTORS<->EGOS" box, links between team members and actor terms can be explored. In this case Rice and Powell share arafat, fox, and bin_laden in common. In terms of unique actor terms, Powell has pervez, kharzai, and musharraf connected only to him while Rice has hussein connected uniquely to her. Rumsfeld has reagan, pm_blair, and frank unique to him.
A similar examination of roles finds Powell with no unique role terms connected exclusively to him. He does, however, share al-qaeda with Rumsfeld and sec(secretary) with Rice, Cheney and Rumsfeld. Rice has advisor unique to her and Powell shares president with Rumsfeld. With regard to organizations and nations ("ORGS/NAT") Powell has the words china, united_states, iran, and israel unique to him and shares afghanistan with Rice. Powell is linked to Rumsfeld through the terms afghanistan, pakistan, iraq, united_states, and pentagon, revealing a high degree of overlap between the two when it comes to mostly Arab nations.
"TERMS" can be examined in a similar manner. However, the large number of terms contributes to a complicated graph. In order to simplify the graph and explore the connections among terms and team members, the "labels" box under "Terms" should be turned off and individual nodes can be identified by left-clicking on the node of interest and the label for that node can be read in the lower left corner of the graph. As can be seen from an examination of the network of relations Rumsfeld, by far, has the largest number of unique terms connected exclusively to him (the ring of blue nodes projecting out from each of the team members represent nodes uniquely connected to each member).
Analysis of Time Slices
We
now present a series of kinemages providing snapshots of networks at various
times over the 66 days of reporting. Time slices were selected on the basis
of important events that happened during this period. For example, day 27
is the day on which the air campaign began in Afghanistan (Figure 17). Each
of the kinemages will be structured
and analyzed in a manner similar to the discussion above with respect to
Figure 15.
Figure 15. Kinemage 3: Aggregation
of all 66 time periods comparing ties between inner circle and organizations,
roles, important actors and other terms. The complexity of this Ākinemage can be reduced
by clicking Āon and off the nodes, labels, and/or edges. The words
were categorized into five groups to Ābetter facilitate Āvisualization. EGOS consists of all team members (excluding Bush),Ā ORGS/NAT Āconsists of Āorganizations
and nations, ROLES Ācontains various role terms (e.g., major, administrator
under secretary), ACTORS Āconsists of Āproper names other than team
members, and TERMS contains all other words. The kinemage can
be rotated to reveal various aspects of the structure.
Moving through an examination
of connections between the team members and words within the five categories
we can see that the most active team members two days after the attack
on the World Trade Center and the Pentagon were Powell, Card, and Ashcroft
(Figure 16). Powell and Cheney are linked during this period and, although
Rumsfeld is present in this period, he has a relatively small number of words
uniquely connected to him. Card is the only team member to have "ACTORS" connected
to him and involves the terms feldman and casey. This is, of
course, early in the 66-day period, with most of the news reporting focused on the
event itself. More actors? names would come into play in subsequent days,
as there was more speculation on who was behind the attacks and on administration
attempts to build a coalition on the war on terrorism. With respect to organizations
and nations Card, Rice, and Ashcroft are connected to the word white_house,
while Powell is not.
By day 27, marking the beginning of the air campaign in Afghanistan, only Rumsfeld and Cheney are present in the news. Rumsfeld dominates this period and Cheney is tangentially in the news, mostly regarding his residence in an undisclosed location. In another eight days, the news is dominated by Rumsfeld, Powell and Rice (Figure 18) during a period when the United States is coming under increasing criticism for collateral damage in the course of the air campaign. Rice and Powell are mutually connected to the words security and washington while Powell and Rumsfeld are tied to day, sec, and washington. With regard to "ACTORS" Rice is connected to yassar_arafat, Powell to musharraf, and Rumsfeld to myers. Powell has no role terms tied uniquely to him and shares sec with Rumsfeld. Unique to Rice is interviewer and adviser while Rumsfeld is uniquely connected to general. There is also no overlap during this period with respect to organizations and nations. Powell is exclusively connected to india and pakistan, Rice to united_states and afghanistan, and Rumsfeld to taliban. Connections to terms also reflect possible differences in roles among the three team members during this period. For example, Powell is connected to talk and diplomatic while Rice is connected to war and Rumsfeld to warn and convoy. Although the three team members have similar levels of centrality during this period, it appears that they were dealing with separate concerns. Powell is dealing with diplomatic issues surrounding the troubles between Pakistan and India while Rice and Rumsfeld are dealing with issues surrounding the war in Afghanistan and collateral damage.
The final two kinemages provide
the network of connections around the beginning of the ground campaign (Figure
19), and the day the Northern alliance entered Kabul (Figure 20). The activity
on day 51 is dominated by Ashcroft, while day 65 is dominated by Ashcroft,
Rumsfeld, and Cheney. Rumsfeld and Cheney are directly connected and the
three are jointly connected by such words as united_states, war, military,
wednesday, and taliban. Powell is not present during this period.
Figure 16. Kinemage 4: Day 2 - Shortly after the terrorist attack on the WTC and Pentagon.
Figure 17. Kinemage 5: Day 27 - Beginning of U.S. air campaign in Afghanistan.
Figure 18. Kinemage 6: Day 35 - U.S. comes under criticism for collateral damage.
Figure 19. Kinemage 7: Day 51 - Beginning of U.S. ground campaign in Afghanistan.
Figure 20. Kinemage 8: Day 65 - Northern Alliance enters Kabul.
Summary of Analysis II
Rumsfeld was the most central (for both types of centrality) over the course of the 66 time points, although his prominence becomes clearer just prior to the beginning of the air campaign. Powell?s centrality varied highly and his role primarily concerned relations with other countries other than Afghanistan with very little overlap in other domains. Much of Powell?s activity was concentrated in the first few days following the attack on the World Trade Center. In addition, he had centrality profiles (both betweenness and degree) more similar to Rice than to any of the other team members, and overlapped highly with Rice with respect to foreign policy-related terms, possibly reflecting potential role conflicts. Additionally, Powell was associated with diplomatic efforts on a variety of fronts (some of which overlapped with Rice) while Rumsfeld and Rice were more associated with the war in Afghanistan and related issues. Cheney, Ridge, and Card had dramatically different centrality profiles from other team members, possibly reflecting their unique roles in the war on terrorism.
In a series of 3D visualizations, networks were examined at critical times during the 66-day period (e.g., beginning of air strikes, beginning of ground offensive). These kinemages of the CRA networks confirmed much of what was observed in the centrality profile analysis although with an expanded ability to explore the data at different points in time. As in the centrality analysis, Rumsfeld was the most prominent member of the team during this period. Analysis of other periods revealed that following Powell?s initial high connectance, he tended to have limited centrality over time and had a high degree of overlap of words with other members of the inner circle. Rumsfeld was the most central (for both measures) over the course of the 66 time points, although his prominence becomes clearer just prior to the beginning of the air campaign. There is a definite dominance of military related terms over diplomatic related terms, the realm of Powell.
Overall Conclusions From the Analyses
The formal job description for Powell places him clearly as the chief foreign policy advisor to the President:
"The Executive Branch and the Congress have constitutional responsibilities for U.S. foreign policy. Within the Executive Branch, the Department of State is the lead U.S. foreign affairs agency, and the Secretary of State is the President?s principal foreign policy adviser. The Department advances U.S. objectives and interests in shaping a freer, more secure, and more prosperous world through its primary role in developing and implementing the President's foreign policy." [U.S. State Department web site]Rumsfeld?s official formal role in the administration is that of chief defense policy advisor:
"The Secretary of Defense is the principal defense policy advisor to the President and is responsible for the formulation of general defense policy and policy related to all matters of direct concern to the Department of Defense, and for the execution of approved policy. Under the direction of the President, the Secretary exercises authority, direction and control over the Department of Defense." [U.S. Department of Defense web site]Given the foreign policy implications of September 11, the data suggest that Powell has played less of a role then might be expected given his formal status as the President?s chief foreign policy advisor and that Rumsfeld played more of a role than might be expected given his formal status as Secretary of Defense, at least as depicted in Reuters news tickers over the period analyzed. In the final analysis, however, there is no doubt that because the reporting of military matters and solutions in Reuters news far outweighed the reports on international political initiatives that would possibly be connected to the Secretary of State, Rumsfeld had a much greater presence in the news. What that means in terms of the workings of the White House inner circle is still open to interpretation. However, this does stand in stark contrast to earlier administrations and U.S. military interventions where, for example, ĀSecretary of State Madeleine Albright in the late Clinton Administration spearheaded the war in Kosovo (in fact it has been referred to as Madeleine?s war). Nevertheless, we provide this visual analysis in the hope of showing the potential power of the visualization methods for exploring problems of the kind discussed here.
Concluding Remarks
We caution that the patterns that we have identified in this analysis are patterns that occurred in Reuters news tickers. Many factors affect how news is produced and which of these reach a final audience; governments have to present themselves in favorable ways to maintain trust and confidence in their effectiveness. This is especially true in times of crisis. Timing and coordinated presentation are one of the ways to achieve this, and non-disclosure and classification of certain information are another. News companies are intermediaries that collect and disseminate information to clients and customers. These organizations are by no means completely objective and do not just simply provide the facts. Maintaining successful customer relationships also means the need for news organizations to adapt to customer preferences; certain news stories might be less desirable than others while yet other slants may be more preferred or easier to communicate. Mass communication cannot be expected to be independent of what people like to hear and what editors (or owners) want to present.
Especially in times of significant events like September 11, news reports can be expected to reflect a complicated mixture of many influences. Until now empirical social science has had difficulty coping with the complexities of mass communication. The sheer amount of information transmitted in today?s system of mass communications has until very recently been completely out of reach of the analytical abilities of most social scientists. Modern computers, powerful analytical tools, advances in network analysis and recent developments in visualization techniques together with advances in applications of natural language computing technology, like CRA, promise to change all this.
The combination of methods used in this article, for example, seems therefore to be very well suited to:
(1) explore and understand the social roles of individuals from an analysis of
the overlap of words in different types of text (e.g., internal company memos,
news transcripts),
(2) compare patterns in the news from different companies (e.g., conservative versus
liberal news organizations),
(3) explore systematic differences for national perspectives (e.g., news reports for
New England versus the South), and
(4) detect shifts in focus by comparing different sources; how for instance government
statements are transformed by news companies.
The identification of persistent patterns in the semantic structures of different sources, which are typically beyond the scope of individual observation, opens the way for a new understanding of the manner in which we are affected by institutions that surround us in our daily lives.
References
Batagelj, V. and A. Mrvar. "Pajek 0.79" (2002). Available: http://vlado.fmf.uni-lj.si/pub/networks/pajek/ [March 22, 2004].
Corman, S. R., T. Kuhn, R. D. McPhee, and K. J. Dooley. "Studying Complex Discursive Systems: Centering Resonance Analysis of Communication," Human Communication Research 28, 2 (April 2002).
Dooley, K. and S. R. Corman. "Electronic Coverage of 9/11" in Communication and Terrorism: Public and Media Responses to 9/11 edited by B. S. Greenberg (Cresskill, NJ: Hampton Press, 2002).
Freeman, L. C. "Visualizing Social Networks," Journal of Social Structure 1, 1 (February 4, 2000). Available: http://www.cmu.edu/joss/content/articles/volume1/Freeman.html [March 22, 2004].
Freeman, L. C. "Centrality in Social Networks: Conceptual Clarification," Social Networks 1 (1979): 215-239.
Freeman, L. C., C. M. Webster, and D. M. Kirke. "Exploring Social Structure Using Dynamic Three-Dimensional Color Images," Social Networks 20 (1998): 109-118.
Greenacre, M. J. Theory and Application of Correspondence Analysis (London: Academic Press, 1984).
Johnson, J. C.,Ā L. A. Palinkas, andĀ J. S. Boster, "Informal Social Roles and the Evolution and Stability of Social Networks" in Dynamic Social Network Modeling and Analysis (Washington, DC: The National Academies Press, 2003a).
Johnson, J. C., J. Boster, and L. Palinkas. "Social Roles and the Evolution of Networks in Isolated and Extreme Environments," The Journal of Mathematical Sociology 27, 2-3 (2003b): 89-122.
Johnson. J. C., D. C. Richardson, and J. S. Richardson.Ā "Network Visualization of Social and Ecological Systems."Ā Paper presented at the Russian-American Workshop on Studies of Socio-Natural Co-Evolution from Different Parts of the World, Academgorodok, Siberia, September 2002.
Johnson, J. C., S. P. Borgatti, J. J. Luczkovich, and M. G. Everett. "Network Role Analysis in the Study of Food Webs: An Application of Regular Role Coloration," The Journal of Social Structure 2, 3 (May 8, 2001). Available: http://www.cmu.edu/joss/content/articles/volume2/JohnsonBorgatti.html [March 22, 2004].
Krempel, L. Netzwerkvisualisierung: Prinzipien and Elemente einer graphischen Technologie zur multidimensionalen Exploration sozialer Strukturen (2002). Introduction and overview available in English: http://www.mpi-fg-koeln.mpg.de/~lk/netvis/onlinepdf/englishintro1.pdf [March 22, 2004].
O'Rourke, Joseph. Computational Geometry (Cambridge: Cambridge University, 1994).
Richardson, D. C. and J. S. Richardson. "The Kinemage: A Tool for Scientific Communication," Protein Science 1 (1992): 3-9.
Sedgewick, Robert. Algorithms (Reading: Addison Wesley, 1998).