JoSS Article: Volume 8
Visualizing the Signatures of Social Roles in Online Discussion Groups
Howard T. Welser, welser@ohio.edu *
Eric Gleave Danyel Fisher and Marc Smith Abstract: Social roles in online discussion forums can be described by patterned characteristics of communication between network members which we conceive of as ‘structural signatures.' This paper uses visualization methods to reveal these structural signatures and regression analysis to confirm the relationship between these signatures and their associated roles in Usenet newsgroups. Our analysis focuses on distinguishing the signatures of one role from others, the role of “answer people." Answer people are individuals whose dominant behavior is to respond to questions posed by other users. We found that answer people predominantly contribute one or a few messages to discussions initiated by others, are disproportionately tied to relative isolates, have few intense ties and have few triangles in their local networks. OLS regression shows that these signatures are strongly correlated with role behavior and, in combination, provide a strongly predictive model for identifying role behavior (R2=.72). To conclude, we consider strategies for further improving the identification of role behavior in online discussion settings and consider how the development of a taxonomy of author types could be extended to a taxonomy of newsgroups in particular and discussion systems in general.
Threaded conversations represent one of the most common modes of interaction in the online world. They occur in web forums, email lists, wikis, newsgroups, and blogs. People contribute to these conversations for a variety of reasons: for debate, to express appreciation or affiliation, to build a sense of community, to provide and receive social support, to collect information, and to provide answers to questions. When people systematically participate in a particular manner, they can be seen as playing a social role. For instance, those that systematically express appreciation or affiliation can be understood to play the social role of a fan. Others might participate out of a more general interest in the discussion, and still others (answer people) might primarily contribute advice and answers to the questions of others. The central premise of this paper is that we should be able to recognize the roles that people play by measuring behavioral and structural “signatures” of their participation. We test this premise by narrowing our focus to distinguishing one particular role from others, the role of the answer person.
For a variety of theoretical and practical reasons, the answer person role provides a good test for the structural signatures approach. An answer person is a participant in an online discussion group whose primary mode of interaction is the provision of helpful, informative responses to other group members’ questions. The answer person is a well recognized social role in online discussion spaces (Golder 2003; Viegas and Smith 2004; Turner, Fisher, Smith, and Welser 2005). Substantively, they are important because answer people collectively donate vast amounts of valuable advice to those who ask questions, resulting in the creation of valuable online resources. The hosts and users of online discussions would like to be able to identify the providers of the most valuable information (Wenger 1999; Lesser and Storck 2001) and cultivate communities of practice that support such sharing (Wenger, McDermott, and Snyder 2002). More generally, an answer person’s apparent altruism provides an important explanatory challenge for models of collective action (Olson 1971; Ostrom 1991), raising the possibility that people may be contributing to public goods for social goods like status (Gilbert 1990; Weber 2004; Welser 2006).
Drawing on research on social networks (Nadel 1964; Burt 1992, Faust and Skvoretz 2002, Freeman 2000), computer mediated communication (Turner et al 2005; Donath 1999) and data mining (Cortes and Pregibon 2002), we develop this analysis in two stages: developing insight into signatures and testing their ability predict role behavior. First, we use visualizations of networks of reply connections and the behavioral histories of contributions to develop and extend intuitions about distinctive structural features of the answer person role, as suggested by Viegas and Smith (2004) and Turner et al. (2005). The distinctive structural features associated with a social role can be thought of as “structural signatures” (Faust and Skvoretz 2002; Skvoretz and Faust 2002). We identify a structural signature for answer people with three features based on the local network attributes and the types of threads to which answer people tend to contribute. First, answer people tend to be disproportionately connected to alters with low degree. That is, they reply to relative isolates, authors who themselves answer few, if any, others. Second, their local (degree one) networks tend to have small proportions of three-cycles (i.e. their neighbors are not neighbors of each other) and they seldom send multiple messages to the same recipient (few intense ties). Finally, answer people tend to reply to discussion threads initiated by others and typically only contribute one or two messages per thread.
In order to test the ability of these features to identify answer people, we first translate the theoretically relevant dimensions of behavior represented in the visualizations into metrics, and then use these metrics to predict the probability that any message drawn from a given actor will be related to the answer person role. We find that each of these features is strongly correlated with answer person behavior and that, in combination in an OLS regression model, they can predict 72% of variation in such behavior. Our analysis also suggests that cases poorly fit by the model are more common among actors with relatively low levels of activity. We suggest some strategies to overcome this limitation.
Social roles are a foundational concept in social analysis, but one that lacks a clear definition and method for their identification based on objective measures. Developing methods to find a particular role and then testing those methods advances our understanding of this important concept. Developing methods for finding roles in online data is especially important because such data are increasingly available and often has multiple dimensions that can be leveraged simultaneously, allowing relative accuracy of the different methods to be compared. Methods for finding roles in online data will be helpful for users and organizers of online forums who may be able to use these techniques to build reputation systems which identify helpful or deleterious users. In particular, methods that allow us to find answer people can be used by managers of online groups to reward and encourage valuable contributors or to develop better algorithms for collecting answers that are likely to be high quality. Finally, these methods contribute to our ability to identify social roles and thus provide a foundational step towards the development of a taxonomy of contributors to online discussion spaces.
Social Roles. The concept of a social role has long been central to sociology (Parsons 1951; Merton 1968; Callero 1994). Our research relies on the basic intuition that any role is a combination of particular sets of behavioral, meaningful, and structural attributes. For instance, the social role of father includes a meaningful schema of what a father is and that schema is associated with appropriate interactions, behavioral expectations, and the occupation of particular social structural relations. If we are studying interaction on a playground, we could use our knowledge of any of these dimensions to learn which of the people were playing the role of father. For instance, if we see an adult male comforting an injured child with a hug, we could take that behavioral and relational data as evidence that that adult is a father to that child. The more extensive our data about interactions and structural relations, the better we would be able to identify which roles were being played by whom. Data derived from online settings are ideal for studying roles because they allow researchers to simultaneously bring network structure, behavioral patterns, and the meaning of interactions (via content analysis) to bear on the task of accurately identifying roles.
Social Roles Online. There are many important social roles in online discussion groups: local experts, answer people, conversationalists, fans, discussion artists, flame warriors, and trolls (Burkhalter and Smith 2003; Golder 2003; Turner et al 2005; Herring 2004; Haythornthwaite and Hager 2005). These social roles have primarily been identified through ethnographic study of the content of interaction (Golder 2003; Donath 1996; Marcoccia 2004) while some effort has been made to use behavioral and structural cues to recognize these roles (Viegas and Smith 2004; Turner et al. 2005). These approaches leveraged visualizations of initiation, reply and thread contribution rates over time to identify distinct patterns of contribution. Exploring these images led to the identification of additional roles including “question person” and “discussion person” who contribute initial turns that elicit brief replies or who typically reply to threads initiated by others with large numbers of additional messages.
Of these roles, the answer person is important for pragmatic and theoretical reasons. Online discussion groups exist for almost any focal activity, from kite flying, computer programming, or music performance, to political activism and beyond. In these spaces it is common to find people asking and answering questions. An answer person is a participant in an online discussion group whose primary mode of interaction is the provision of helpful, informative responses to other group members’ questions. The best answer people will provide prompt, accurate, and thorough help. Participants who enact this role are an important source of the value found in online discussion groups. They offer this help to potential strangers without direct compensation or expectation of reciprocity and, often, without thanks.
Developing methods that accurately distinguish the answer person role without requiring analysis of content is of great potential benefit to organizations that want to cultivate valuable online communities (Wenger, McDermott, and Snyder 2002) and for developing effective search strategies to highlight the best answers from the vast banks of message records. Furthermore, identifying answer people is sociologically meaningful because their apparent altruism (Moghaddam 1998; Fehr and Fischbacher 2003) raises theoretical questions about why people contribute to public goods and the nature of institutions that will enhance that contribution (Olson 1971; Coleman 1990; Ostrom 1991). Research on contributions to Open Source Software has raised similar questions about why programmers donate their time (Lerner and Tirole 2002; Weber 2004). Data from online discussion spaces like Usenet offer new insight into this general issue because Usenet newsgroups are organized around a wide array of topics and thus allow us to evaluate the conditions where such helping behavior is more or less prevalent. A precondition to such comparisons is developing the ability to distinguish answer people from other users based on easily observed data like network structure or behavioral metrics.
Networks and Structural Signatures of Social Roles. In general, network studies of roles are premised on the notion that structural similarity indicates a class of similar actors which may correspond to social roles (White, Boorman and Breiger 1976; Winship 1988). In particular, the family of equivalence methods is often used to break a population of actors into classes based on graph-wide measures, and relationships among these classes are used to identify roles (Wasserman and Faust 1994). However, we are less concerned with assigning all actors to different classes than we are in identifying general structural features that are associated with one particular role. Therefore we use degree one ego-centric network data and visualization to identify structural attributes associated with the answer person role.
A handful of network studies provide helpful models for our techniques. Mizruchi (1993) compared the relative ability of measures of cohesion and structural equivalence to predict a corporation’s political donation activity. Although the explanatory power of the models was limited, this study is important because it tested the adequacy of the equivalencies. Ronald Burt’s inquiry into structural holes emphasizes how metrics based on local network measures can identify important types of social actors at the edge of structural holes (1992, 2004). Erickson’s work on bridge-playing teams highlighted the relevance of structural characteristics to the role of a prestigious player (1984). Our research follows these by testing structural indicators against reliable measures of role behavior like the content of their messages.
Systematic Behavior and Behavioral Signatures of Social Roles. In many well-defined circumstances, it is generally safe to assume that past behavior will correlate with future behavior. Signatures can be derived from patterns in behavior accumulated across time. For example, this notion of a behavioral “signature” is central to efforts of researchers at Bell Labs to discern fraudulent telephone accounts by capturing patterns in volume, timing, and the identity of in-bound callers. Despite the practice of frequent changes in phone numbers and accounts, fraudulent telephone accounts could be rapidly detected once a new account began to receive calls from people who had also called accounts that were previously detected as fraudulent (Cortes et al. 2000; Cortes and Pregibon 2004). Similarly, analysts of credit markets use clean and consistent driving records as proxy signatures for good credit risks where credit data are unavailable (Guseva and Rona-Tas 2001). The same principle of using readily observable behavioral patterns as indicators of an underlying individual attribute can be extended to the study of social roles..
Indicators of Roles in Online Discussions. Previous research has begun to associate behavioral and structural features with different types of contributors to online discussion groups. Viegas and Smith (2004) introduce the authorline visualization and use it to distinguish between different types of online contributors like spammers, debaters, and answer people based on the number and type of messages they contribute to different discussion threads. Turner et al. (2005) expand this inquiry to explore posting behavior, local network attributes, and types of newsgroups. However, their analyses of social settings and roles in online community are primarily illustrative and do not test the degree to which visualizations accurately identify roles. Our approach combines insights from the above to bridge between Turner et al.’s impressionistic approach, and the more systematic strategies of Cortes and Pregibon (2004), Burt (2004) and Fisher, Smith and Welser (2006).
This study comprises two linked but separate analyses: first, an exploratory stage where we used visualization to develop insight into possible signatures of the answer person role; and a confirmatory stage where we use OLS regression to test the ability of those signatures to predict role behavior. As such, the description of the data and measures involved are likewise separated into two linked but distinct sections. The first deals with the creation and interpretation of visualizations. The second deals with metrics derived either from qualitative codings of the visualizations themselves or from the underlying data used to generate the images. We discuss the context, data, and visualization strategies before proceeding to the analyses.
Context of Analysis. Threaded discussions allow asynchronous, large scale, many-to-many conversations (see Sack 2002), and they can result in the accumulation of huge conversation records. Thus they provide uniquely detailed and extensive sources of data that reveal the structure and content of computer-mediated social interaction. For reviews of related research from a variety of disciplines see Wellman, Salaff, Dimitrova, Gulia, and Haythronthwaite (1996); Wellman (2001); Howard (2002); Schnieder and Foot (2004), Haythornthwaite and Hagar (2005), and research in the ‘Persistent Conversations’ HICSS minitrack (Erickson and Herring, 2005).
The Usenet is the world’s largest system for threaded discussion, involving over a hundred thousand topically differentiated newsgroups (for a general description of the Usenet, see Pfaffenberger 2003). Usenet messages are distributed through news-servers provided by Internet Service Providers and can also be accessed via dedicated software clients (newsbrowsers) as well as web based interfaces like Google Groups. Usenet newsgroups are subdivided into general discussion areas called hierarchies, which are indicated by the prefix attached to the name of the group (e.g. sci indicates science discussion topics). Not only do people socialize in threaded discussions, but the spaces they create are increasingly recognized as settings for ‘communities of practice’ (Wenger 1999; Howard 2002). Communities of practice are informal groups of people who regularly share their expertise and experiences. They are self-directed and can be largely autonomous from formal organizational controls (Wenger and Snyder 2000), and are often seen in the business world as important means for generating value and motivating contribution (Wenger 1999; Lesser and Storck 2001). That said, not all online discussion groups become communities of practice oriented around the generation of valuable information and help. Some, like alt.flame, are dedicated to disrupting other newsgroups. Furthermore, as any reader of threaded discussions quickly recognizes, many groups have far more noise than signal.
Outside of Usenet, many discussion systems have addressed this problem with institutional or formal systems for assigning reputation and moderating posts (e.g. Slashdot). For instance, the reputation system at Slashdot allows members to score the quality (1-5) and nature of others’ posts (insightful, funny, etc.). However, formal reputation systems are no panacea. The people who earn good reputations may well be those who are skilled at boosting their reputation scores and not those who are most helpful (see also Lampe 2004). Therefore, for both moderated and unmoderated discussion groups, a major research challenge is to develop the ability to identify groups with good information and identify valuable contributors without inspecting every message in a collection.
Case Selection. The current analysis focuses on three Usenet newsgroups: comp.soft-sys.matlab (“Matlab”), microsoft.public.windows.server.general (“Server General”), and rec.kites (“Kites”). In each of these newsgroups there is some combination of general discussion and question-and-answer. Aside from this commonality, these newsgroups vary widely in both content and form. In particular, we included Kites because it is primarily a discussion newsgroup, and thus it provides an initial test for the signatures we identified to travel beyond technical help newsgroups. Kites, then, is a challenging case; while Server General and Matlab are both cases where questions and answers seem to be more central social practices.
Cornell University
Ohio University
University of Washington
Microsoft Research
Microsoft Research
Introduction
Finding Social Roles in Online Discussion
Structural Strategies for Identifying Social Roles
Roles can be studied by comparing behavioral and structural patterns to the content of peoples’ interaction (Nadel 1964). Faust and Skvoretz (2002; and Skvoretz and Faust 2002) use the term 'structural signature' to refer to distinctive attributes that define types of networks. Although they seek to characterize structural signatures across networks of different species, the notion of a structural signature can be applied to role behavior: distinctive positional attributes that distinguish actors as occupants of a social role. To the extent that we can identify a structural signature, we should be able to identify answer people without evaluation of the content of their messages, thus dramatically decreasing the time it takes to discern particular types of contributors.
Methods: Context, Data, Measures
Table 1: Population Size for Sampled Groups |
||||
Group Measures |
Server |
Matlab |
Kites |
|
Messages |
2,700 |
1,400 |
1,600 |
|
Repliers |
468 |
300 |
260 |
|
Returnees |
155 |
150 |
150 |
|
Table 1 summarizes the active populations for the three newsgroups. It is difficult to characterize the size of an online discussion group because many readers never post messages, and others are transient or are posting spam. The best measures are those that capture the number of consistent contributors to conversations. Following Smith (2003), we use measures of the number of repliers (those who replied to at least one message in a given month, and thus were involved in a conversation in the group) or the number of returnees (those who were seen in a previous time period, in this case a month). The three newsgroups all have about 150 returnees. However, posting activity is much higher (2,600 messages) in Server General than in the others (about 1,500 messages each).
Data. While message contents were collected from Google Groups, all of the network and posting structure data were collected using Netscan. For details and further information on Netscan, see http://netscan.research.microsoft.com or Smith (2003). Information drawn from the headers of Usenet posts (collected by Netscan) include the date the message was sent, the addresses of the sender and the recipient, the destination newsgroup or newsgroups, the subject of the post, and several other pieces of information. Data were collected and visualizations were generated for all people who replied to at least one message or received at least one reply during the study. From the raw data we constructed behavioral visualizations and network data sets based on reply relationships. We coded role behavior by reading the content of discussion threads through the Google Groups' Usenet search interface. Content and network data were collected for one month, while data in the Authorline were collected for an entire calendar year. The Authorline is a type of longitudinal bar chart for threaded discussions (created by Viegas and Smith 2004). We discuss the data in more detail in relation to the various visualization and analysis strategies employed. For the regression analysis, we used number of repliers to define a subset. We sampled about 10% of the most active repliers (30 Kites, 35 Matlab, 46 Server General).
Visualizations
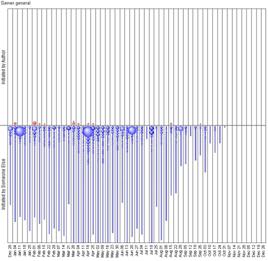
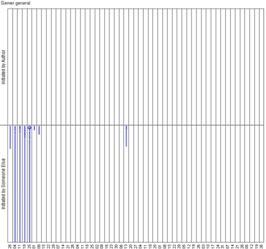
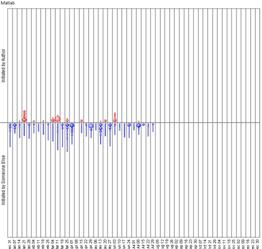
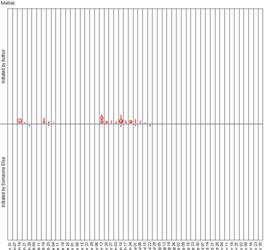
Authorlines. (See Figures 1 and 2.) An authorline represents the volume of contribution for a single actor across all the weeks of a given year. Each vertical strip represents one week. Each circle represents a thread in which the actor participated during this week. Red circles stacked above the central horizontal line represent threads initiated by the selected author. Blue circles below the horizontal axis indicate threads initiated by someone else that were replied to by the selected author. The diameter of a circle represents the number of messages posted by the selected author to that thread during that week. The smallest circles in Figure 1 indicate threads to which the author posted only one message, while the largest circles indicate three or four messages by that author to the same thread in a single week. Authorlines were generated using Usenet Views, a Netscan database interface (available with the Netscan Sample Database). For our purposes, the general tendencies in types of threads, number of threads, and volume of contribution to each thread are of interest. The exact timing of a given thread is not important for characterizing roles.
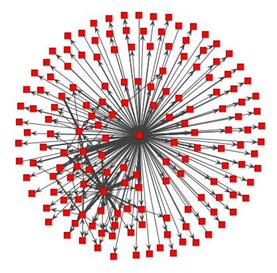
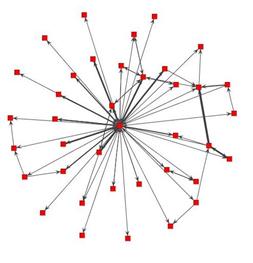
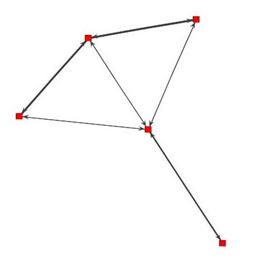
Local Network Neighborhoods. (See Figure 3.) We concentrate on network visualizations of actors’ local N-1 neighborhoods (Hanneman and Riddle 2005), examining the set of all ties between the nodes at distance one from the actor. We discuss these ego networks as local networks because we want to draw attention to the structure of relations among those in ego’s immediate neighborhood rather than focusing on ego, per se. The corresponding visualizations and statistics were generated using the “JUNG” toolkit (O’Madadhain, Fisher, White and Boey 2003). Once again, in these visualizations we are primarily interested in general tendencies such as differences between sparse and dense graphs, and graphs with relatively large numbers of intense ties.
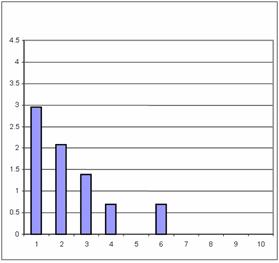
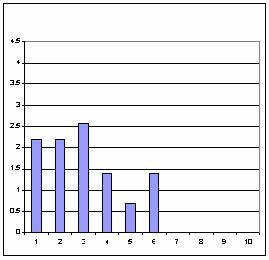
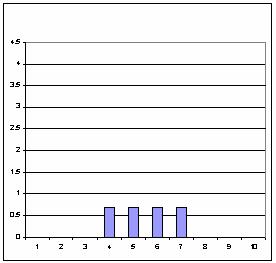
Distribution of Neighbors’ Degree. (See Figure 4.) The Degree Distribution Chart is a histogram displaying the distributions of each actor’s neighbors’ degree (see Fisher et al. 2006). Because the tie distributions are highly right-skewed and counts can vary greatly, we collect ties into exponentially increasing bins and we log the resulting counts (ln(count+1)). This allows us to compare counts that can vary from one to hundreds and neighbors’ degrees that vary from one to hundreds within the same visualization. Counts of neighbors’ degree were calculated in JUNG, but the histograms were simply generated in Excel.
Coding Behavior from Message Content. Since we are testing the ability of behavioral signatures to identify social roles we need a baseline measure of role behavior. In this instance we coded the content of the most active actors’ posts by reading the threads in which they posted messages, and coded instances of interaction as indicative of role related behavior: questions, answers, answering-related behaviors, and discussion. For each actor in the sample, we sampled the greater of either ten posts that they had authored, or 15% of their posts, chosen randomly. [1] For actors with fewer than ten posts, we coded every one of their posts.
For each sampled message, we interpreted the content of the message in the context of the thread in which it appeared. We defined an instance of interaction as communication that either responded to communications of others, or (in the case of questions) was clearly inviting a response. Most threads showed a dyadic interaction initiated by the coded actor or by their alter (for instance, a question is raised and answered). However, in others, multiple categories of interactions were present in a single message. We recognize that people can perform roles to varying degrees and may play multiple roles (Callero 1994). Therefore, we code particular interactions as consistent with given roles but recognize that individuals are likely to play different roles at different times, and thus measure the proportion of interactions consistent with particular roles. We coded interactions into broad categories of answering, answer related, discussion, and question asking. Answer related behaviors included seeking clarification, giving advice, offering support of learning efforts, and sanctioning norm violators. Question asking was defined as explicit requests for information. Discussion included all other exchanges, including playful banter, story-telling, bragging, confrontation, announcement and promotion of events, products, or services.
Answers were direct responses to requests for help that either provided the information requested or pointed to a resource that could provide that information. For example, this is a message coded as an answer:
So there is no way of calling a protected method in Matlab, or are there 'backdoors' ?No, and that's by design. If someone didn't make a method, field, or constructor public, that means that he only wanted it to be called under certain situations. That's just part of OOP data hiding and encapsulation. If we provided such a back-door, you would probably start breaking code *very* rapidly :-)
Analysis
What are the structural and behavioral patterns associated with enacting a social role? To answer this question, we proceed inductively by generating visualizations of behavior and local network position for all actors in our study cases. By comparing large numbers of these visualizations, grouping them, and considering how the behavior patterns relate to known attributes of the answer person role (Viegas and Smith 2004; Turner et al. 2005), we developed intuitions about potential signatures of that role. Because we use these images to gain insight into the general relationship between behavior and social roles in these data, we are not concerned with the fine-grained distinctions in any of the figures. [2]
Potential Signatures of Social Roles
Authorlines. The authorline visualizations in Figure 1 are taken from actors that we suspect exemplify patterns associated with dedicated answer people. We propose that the key behavioral signature of an answer person is seen in the tendency to reply to discussion threads initiated by others, e.g. the presence of blue circles and the absence of red circles indicating thread initiation. The second attribute is a tendency towards brevity--represented by the absence or relative rarity of large circles in the authorline. Combined, we can say that an authorline characterized by numerous small blue circles (and corresponding absence of large or red circles) is likely for actors who are primarily playing the role of answer person. The numerous (about 20 to 50) threads per week and the almost complete absence of large contributions or initiations suggest that figures 1a and 1b come from highly active answer people.
Figure 1a: An exemplary authorline for an answer person
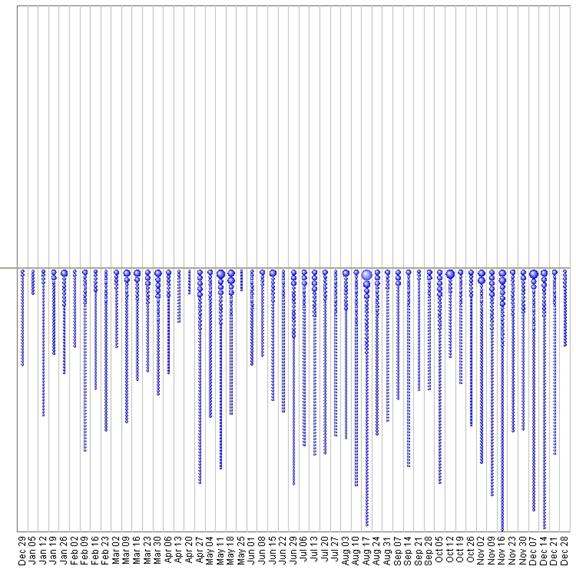
Figure 1b: Another exemplary authorline for an answer person

Figure 2a: An exemplary authorline for a discussion person
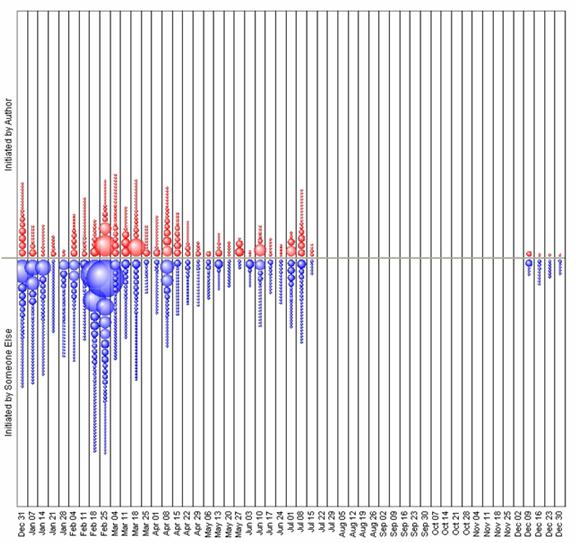
Figure 2b: Another exemplary authorline for a discussion person
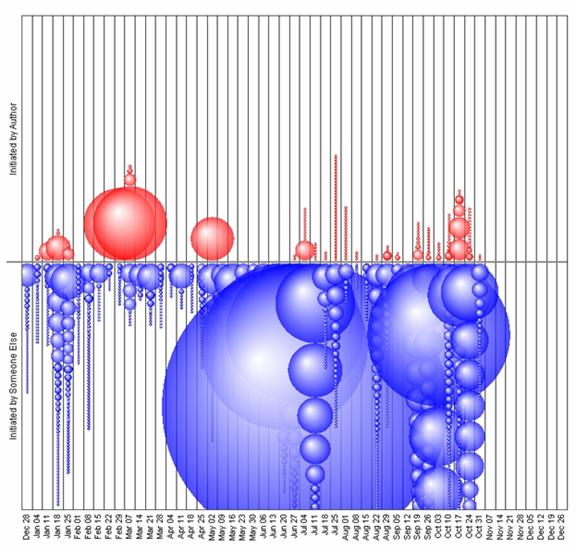
The authorline visualizations in Figure 2 are taken from actors that we suspect exemplify patterns associated with discussion people. We use these as a contrast group to highlight the distinctive features of answer people. As seen in Figure 2, these participants both initiate (red) and reply to (blue) threads and contribute greatly to some threads while posting just one or two messages to others. Such actors are common in discussion groups and are present but less common in the question and answer groups.
Egocentric Networks. Figure 3a shows a good example of the local network pattern that we suspect is associated with the role of an answer person. It is primarily sparse, star-shaped, and has numerous outward connections to relative isolates. Further, the network has few, if any, triangles or intense (more than two messages per dyad) relationships. We arrived at these expectations through a combination of induction and reflecting on the likely structural attributes associated with providing answers to a large pool of users, many of whom are just passing through. Answer people would have little need to send multiple messages to the same recipient, and question seekers would have little reason to contact the other question seekers.
Figure 3a: Exemplary local network for an Answer Person |
Figure 3b: Exemplary local network for a Discussion Person |
|
|
Note: Directed tie = replied to à ; line thickness proportional to # of ties in the bi-directed relation. |
|
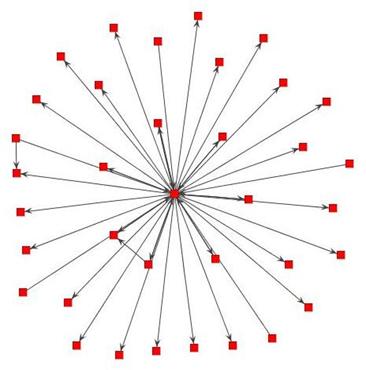
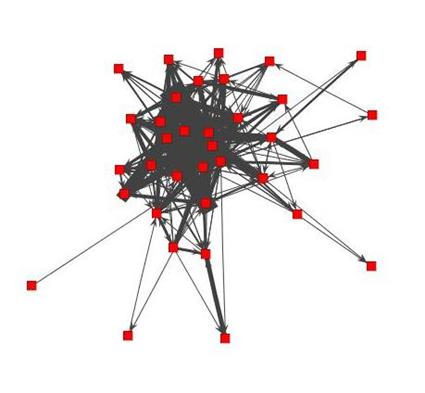
Figure 3b shows a local network that we believe is associated with being a discussion person. The network is dense with many intense ties to highly interconnected alters. When discussion people are tied to relative isolates, those ties are often directed inward, indicating that the relative isolates contact the discussion person.
Distribution of Neighbor’s Degree. Inspection of the network visualizations led us to suspect that answer people are likely to have a distinctive pattern of connections to others. The histograms of neighbors’ degree illustrate this and contrasting patterns associated with discussion people. Answer people are tied to many alters who themselves have few ties and few alters who have many ties. In contrast, discussion people are highly tied to others who themselves have high degree.These patterns are demonstrated by figures 4a and 4b. The author represented in 4a is tied to numerous alters with low degree and a few high degree alters, while the author in 4b is mainly tied to high degree alters. For instance, the author in 4b is tied to 13 alters who each have high degree (within the range 16-31).
Figure 4a: Exemplary neighbors’ degree distribution for a Discussion Person. |
Figure 4b: Exemplary neighbors’ degree distribution for an Answer Person. |
|
|
Note: Both dimensions of each degree distribution histogram are logged. The vertical axis reports ln(count+1) of neighbors who have a degree that falls within each bin. Bins expand by doubling in size after bin 2. Values in included in each bin are: 1(1); 2(2); 3(3-4); 4(5-8); 5(9-16); 6(17-32); 7(33-64); 8(65-128); 9(129-256); 10(257-512) |
|
Comparison of Visualizations
Do visualizations of behavioral history, network neighborhoods, and neighbors’ degree distributions provide consistent indications of roles? We began by generating all three visualizations for every participant in our three groups. Here we discuss two triptychs from each group that highlight issues that emerged in our exploration, and to illustrate how our visualizations were employed. We consider where the visualizations make consistent and correct indications of role performance and where they diverge.
Illustrative Cases from Server General. Server General is the most active of the newsgroups discussed in this paper with about 2,700 posts, 468 repliers, and 155 returnees from the previous month. The newsgroup provides a forum for the discussion of general issues that arise for Windows server operating systems. Server General was chosen to represent a large technical computing group where question and answer exchanges are prevalent.
Figure 5a: Visual profile of the top contributor to Server |
||
|
|
|
Figure 5b: An active contributor to Server |
||
|
|
|

The top row of Figure 5 depicts the most active person in Server General, whose visualizations consistently suggest an answer person. The local network is a large, sparse, outward directed star with many outward ties to relative isolates. The degree distribution shows a concentration of replies to alters with low degree, and the authorline shows evidence of consistent but limited contribution to many discussion threads, very few of which were initiated by the author. Analysis of this person’s posts indicates that 90% of sampled posts were answers and the remaining 10% were answer-related, including seeking clarification and sanctioning a question asker for cross-posting indiscriminately.
The second triptych is consistent with many of the top contributors to Server General. All three of the visualizations are consistent with our proposed answer person signatures: the authorline consists almost exclusively of light contributions to other-initiated threads, the local network is a sparse outward directed star with few intense ties, and the degree distribution is highly loaded on low degree alters.
Illustrative Cases from Matlab. Matlab is a discussion newsgroup focused on the computing language Matlab. Matlab was less active than Server General during the study period with about 1400 posts and 300 repliers, but had a similar size returning population with 150 returnees.
Figure 6a: Most Active Contributor to Matlab |
||
|
|
|
Figure 6b: Contributor whose degree distribution deviates strongly from the answer person pattern |
||
|
|
|
The actor in Figure 6a represents a common pattern for several of the most active in Matlab, combining some features of an answer person with some of a discussion person. All three visualizations are largely consistent with the answer person role. However, the degree distribution is not as skewed towards isolates and s/he is tied to an extensive, if lightly interconnected, network. Also, s/he exhibits more initiation behavior than is typical of pure answer people and has a higher proportion of medium size threads than pure answer people tend to exhibit. Content analysis indicated that seven of the coded interactions involved answering, two were technical questions, and the remaining two were discussion of different sorts. This suggests that high volume contributors to this newsgroup may play a combination of roles.
The actor in Figure 6b was chosen to demonstrate another direction of deviation from the standard answer person role: a persistent question person. S/he is only tied to actors with four or more out-ties, deviating strongly from the answer person pattern. Both of the other visualizations also suggest that this person is not an answer person. First, s/he posts primarily to threads s/he initiated. Second, this actor’s network has high mutuality and few relative isolates. All three visualizations suggest that this person is not an answer person. Correspondingly, content analysis indicated that s/he is an answer-seekerwho either asked questions or gave thanks for answers the majority of the time.
Our further exploration of visualizations showed that Matlab differs from Server General in two important ways: first, there is more interaction among answer people, responding to and evaluating each others answers, and second, Matlab experts who answered detailed technical questions were more likely to ask new questions themselves. This may reflect aspects of this particular community, or it may reflect differences in the focal activities of programming and server maintenance, which o
Illustrative Cases from Kites. Kites is dedicated to the appreciation of kite flying and the development of kite related knowledge and skills. Kites was slightly less active than Matlab with 1600 posts, 260 repliers and almost 150 returnees.
The tendency towards discussion among the most active contributors is greater in Kites than the other two newsgroups. All participants for whom behavior was coded exhibited some discussion behavior, and several were involved exclusively in discussion. Although some question answering takes place, it seems that the most active are behaving more like fans or discussion people than answer people (Golder 2003). This is not surprising given the differences in the subject matter of the newsgroups.
Figure 7a: Most active contributor in Kites |
||
|
|
|
Figure 7b: Contributor to Kites who degree distribution is similar to the answer person pattern |
||
|
|
|
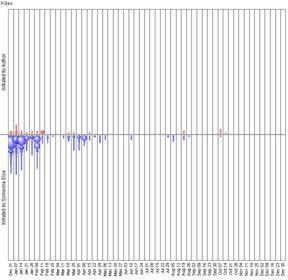
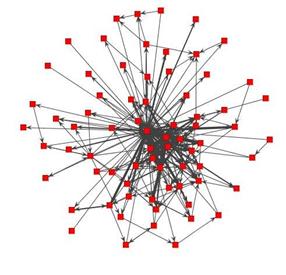

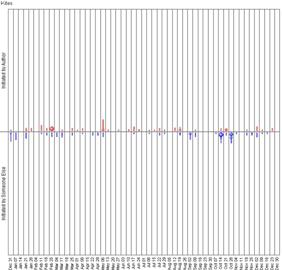
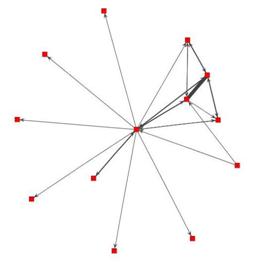
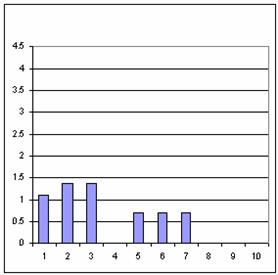
Figure 7 compares the most active member of Kites to an actor whose degree distribution is more consistent with that of an answer person. All three visualizations are primarily consistent with the discussion person or fan role. The actor in 7a is the most active person in Kites. On all three visualizations, s/he is an apparent discussion person. The authorline has relatively numerous initiated (red) threads and a significant, consistent proportion of large replied (blue) threads. The local network indicates non-answering behavior through the numerous intense ties, prevalence of triangles, and absence of outward ties to relative isolates. The prevalence of inward ties from otherwise isolated nodes also indicates that the messages are not replies to others and thus not likely to be answers. Finally, the degree distribution has an approximately normal shape with more ties to active well connected authors than to isolates. In concert, these visualizations indicate discussion behaviors. In fact, this person participated in discussion in over 90% of coded messages.
The actor in 7b was chosen because his/her network visualization and degree distribution is more consistent with an ideal typical answer person. However, the authorline is ambiguous at best with far too many initiated threads relative to replied-to threads to be consistent with answer person behavior. This appears in the form of consistent, light discussion, perhaps indicative of persistent question asking. This person was primarily involved in discussion (60%), and the remainder was answering (20%) and question or thanks (20%).
Confirmatory Analysis: Predicting Roles from Structural and Behavioral Signatures
Data Collection for Regression. We assessed the accuracy of the signatures by translating them into metrics and evaluating how well the metrics correlate with role behavior. We then compared attributes of cases where role behavior was accurately predicted to cases that signatures failed to predict accurately. We focus our sample on the most active contributors to the three selected newsgroups. In order to sample enough individuals, we looked at the content of at least thirty individuals per newsgroup. For improved comparison across newsgroups, however, we then scaled this base level to the number of repliers in each newsgroup. The result was the most active 30 for Kites, 35 for Matlab, and 50 for Server General. Our final N was 111 due to the loss of 4 contributors being composite email addresses (e.g. anonymous@microsoft.com) which suggested multiple people using the same author identifier. Table 2 provides summary statistics for the key explanatory and dependent variables used in the regression analysis below.
Table 2: Descriptives for regression variables |
|||||||||
Combined |
Server |
Matlab |
Kites |
||||||
(111) |
(46) |
(35) |
(30) |
||||||
Authorline |
|||||||||
Average |
0.52 |
1.20 |
0.23 |
-0.17 |
|||||
S.D |
1.59 |
1.61 |
1.59 |
1.15 |
|||||
Min |
-3.00 |
-3.00 |
-3.00 |
-3.00 |
|||||
Max |
3.00 |
3.00 |
3.00 |
1.00 |
|||||
Neighbors' Degree |
|||||||||
Average |
0.70 |
1.24 |
0.83 |
-0.30 |
|||||
S.D |
1.08 |
1.05 |
0.81 |
0.66 |
|||||
Min |
-1.79 |
-1.10 |
-1.61 |
-1.79 |
|||||
Max |
3.09 |
3.09 |
1.95 |
0.81 |
|||||
Local Structure |
|||||||||
Average |
1.69 |
2.02 |
2.09 |
0.73 |
|||||
S.D |
1.12 |
1.06 |
0.98 |
0.74 |
|||||
Min |
0.00 |
0.00 |
0.00 |
0.00 |
|||||
Max |
3.00 |
3.00 |
3.00 |
2.00 |
|||||
Logit of Answer |
|||||||||
Average |
0.34 |
0.57 |
1.27 |
-1.09 |
|||||
S.D |
2.28 |
2.37 |
2.25 |
1.34 |
|||||
Min |
-3.48 |
-3.48 |
-3.48 |
-3.48 |
|||||
Max |
3.48 |
3.48 |
3.48 |
1.39 |
|||||
Proportion Answer |
|||||||||
Average |
0.66 |
0.77 |
0.76 |
0.37 |
|||||
S.D |
0.37 |
0.36 |
0.34 |
0.24 |
|||||
Min |
0.00 |
0.00 |
0.00 |
0.00 |
|||||
Max |
1.00 |
1.00 |
1.00 |
0.90 |
|||||
Coded Actions |
1041 |
417 |
324 |
300 |
|||||
Actions Coded "Answer" |
613 |
283 |
237 |
93 |
|||||
Proportion Answers |
0.59 |
0.68 |
0.73 |
0.31 |
|||||
Measuring Answer Related Behavior. Our primary dependent variable is the degree to which an actor plays the answer person role, operationalized as the estimated probability that a message from this actor is an answer or answer related. We coded each actor by the proportion of their messages that were answers. We then logit-transformed these proportions to obtain an unbounded range of log-odds centered at zero. This standard technique transforms a proportion into a linear variable (the log-odds) suitable for use as a dependent variable in OLS regression. Since the logit of 0 (![]() ) and 1 (
) and 1 (![]() ) are undefined, proportions of 0 and 1 were recoded into .05 and .95 respectively. This pulls our extreme cases away from the extreme possible values, thereby reducing our chances of making a type I error while greatly increasing our risk of a type II error.
) are undefined, proportions of 0 and 1 were recoded into .05 and .95 respectively. This pulls our extreme cases away from the extreme possible values, thereby reducing our chances of making a type I error while greatly increasing our risk of a type II error.
An alternative strategy would use logistic regression after dichotomizing answering proportion at an arbitrary threshold. Imposing an arbitrary threshold would mean discarding meaningful information such as one author answers 20% of the time relative to another who answers 10%, both being reduced to a zero. We therefore employ the logit transformation because it retains more information and allows us to predict variation across the range of behavior. This helps us extend the method to groups where answering behavior is rare, as well as identify relative levels of role enactment. This is more consistent with the theoretical premise that people will often play multiple roles and enact those roles to varying degrees.
Our independent variables are a combination of several statistics derived from the visualizations: (1) a variable representing the distribution of neighbor degrees (2) a summary metric of network measures (3) an observed variable summarizing authorlines data.
Distribution of Neighbors’ Degree. For each actor, the distribution of their neighbors’ degrees can be represented by a single statistic, ![]() , where S is the number of alters with small degree (3 or fewer out-neighbors), and B is the number of alters with big degree (4 or more out-neighbors). The appropriate cutoff value for small and big must be chosen by the researcher for the network being considered. Our choice of 4 marking the start of big follows from considering the observed distributions from hundreds of neighbor degree histograms. Logging the ratio removes the bounds of the distribution and centers it on 0, a point of equal connection to big and small degree alters. This statistic reports large positive numbers for actors who are disproportionately tied to alters of small degree, large negative numbers for those who are disproportionately tied to alters with big degree, and values near zero for those who are approximately equally tied to alters of big and small degree.
, where S is the number of alters with small degree (3 or fewer out-neighbors), and B is the number of alters with big degree (4 or more out-neighbors). The appropriate cutoff value for small and big must be chosen by the researcher for the network being considered. Our choice of 4 marking the start of big follows from considering the observed distributions from hundreds of neighbor degree histograms. Logging the ratio removes the bounds of the distribution and centers it on 0, a point of equal connection to big and small degree alters. This statistic reports large positive numbers for actors who are disproportionately tied to alters of small degree, large negative numbers for those who are disproportionately tied to alters with big degree, and values near zero for those who are approximately equally tied to alters of big and small degree.
Adding 1 to both the numerator and the denominator has two desirable qualities. First, it prevents the ratio from generating undefined values, and second, it leads to more conservative estimates for actors with few observations, reducing the tendency for random fluctuations to be mistaken for extreme values. So, although altering the numerator and denominator biases the value, the bias is theoretically meaningful and scales consistently with degree.
Local Network Structure. As a simple indicator of the local network characteristics discussed above, we constructed an index that coded each actor for being above average (for their newsgroup) on three characteristics that are connected to answer person behavior: proportion of out-ties to low-degree neighbors, triangles, and intense ties. We added one to the index for each characteristic that was consistent with the answer person signature. The resulting index ranged from zero to three. The proportion of ties to low-degree neighbors was defined as the number of outward ties to actors of out-degree 0 and degree of 1 divided by ego’s out-degree. The proportion of intense ties was defined as the number of ties of intensity greater than 1, meaning more than one message was sent within the dyad. (Note that these ties are undirected; a message, its reply (the first tie) and a reply back would count as an “intense” tie). Last, the triangle ratio was defined as the number of undirected, triangles between alters, normalized by the number possible, (degree of ego)*(degree of ego-1)/2 (Brandes and Erlebach 2005).
Authorlines. Authorlines were coded qualitatively from the visualizations on an integer scale between positive three and negative three. The positive extreme represented an authorline that was clearly consistent with the answer person signature attributes: an extremely high proportion (often all) of the threads were small blue circles, indicating consistent behavior of lightly touching threads initiated by others. The negative extreme represented an authorline that deviated strongly from the answer person attributes, especially those that had numerous large contributions to threads or a high proportion of initiated threads which are consistent with patterns typical of discussion people or answer-seekers. Scoring between the extremes reflected a comparison of the volume of information consistent with answer person signatures compared to the volume of information inconsistent with it. [3]
The data composing authorlines differ in two important respects from the network data used in this study. First, authorlines summarize participation in Usenet for a calendar year rather than a month. Second, authorlines report contributions to all of Usenet and not just to a single newsgroup. To the extent that actors role behavior is relatively stable across newsgroups and across time these measurement decisions may help reveal roles where a more limited slice of data would not. In future work we test these assumptions by checking to see if failures to accurately predict behavior are related to temporal and newsgroup discrepancies.
Regression Results
Table 3 reports results from bivariate regressions of each signature on answer person role behavior and a multivariate model that combines the three signatures and adds dummy variables for group membership.
|
Table 3: Associations Between Signatures and Role
Behavior |
||||
|
|
|
|
|
|
|
|
Model 1 |
Model 2 |
Model 3 |
Model 4 |
|
|
β (Std. Error) |
β (Std. Error) |
β (Std. Error) |
β (Std. Error) |
|
Intercept |
|
|
|
-.52* (.24) |
|
Authorline |
.95*** (.08) |
|
|
.73*** (.07) |
|
Neighbor’s Degree |
|
1.30*** (.13) |
|
.61*** (.15) |
|
Local Network |
|
|
1.14*** (.14) |
.24† (.14) |
|
Server General |
|
|
|
-.03 (.31) |
|
Matlab |
|
|
|
.83** (.31) |
|
|
|
|
|
|
|
Adjusted R2 |
0.52 |
0.45 |
0.37 |
0.72 |
|
Notes: |
N=111 ***p < 0.001 **p < 0.01 *p < 0.05 †p < 0.1 |
|||
Bivariate Relationships. Overall, the bivariate relationships show strong correlations between our metrics and answer person behavior, especially authorlines, with a correlation of .72. Investigation of the error distribution for the authorlines showed that the largest errors in prediction occurred where authorlines were coded as zeros, where uncertainty about role behavior was highest. The distribution of an author’s neighbors’ degree is a better predictor than the index of other local network features. The strength of correlations with answering behavior for all three metrics is encouraging, suggesting that the signatures we identified in the exploratory analysis are fairly accurate.
Results of Multivariate Model. In the multivariate model, authorline remains a strong predictor with a coefficient ten times greater than the standard error. Neighbors’ degree distribution is strong as well (p<.01). The effect of composite network attributes (triangles, intense ties, and outward ties to isolates) is largely explained by the other two signatures and retains negligible unique variance explained. Overall, the adjusted R2 of .72 indicates that almost three quarters of the variance in answering behavior is captured in the three signatures and group level variations.
Newsgroup dummy codes were introduced simply to control for possible newsgroup based differences in answering behavior. They reveal only that Matlab has a higher prevalence of answer people than the other newsgroups, due largely to the distribution of answers across more individuals than exists in Server General or Kites.
Lessons from Deviations. Where do the signatures make poor predictions? To explore this question we identified cases where predicted answering behavior deviated greatly from observed behavior. The points of the scatter plot are indicated with the letters S, K, M representing Server General, Kites, and Matlab, respectively. Figure 8 plots the predicted log-odds of answering (X axis) against the observed answering behavior (Y axis) for each author in the dataset. Note that log-odd values are displayed to preserve the linear relationship and to avoid compression of the figure as probability approaches the limits. Recall that a log-odds of zero corresponds to probability of .5, one corresponds approximately to .75, two to .89, three to .95, and 4 to .98. Thus the case from Server in the far upper right of the figure had an observed proportion of answers at .95 (top coding possible) and had a predicted probability of answering of .98.
Figure 8: Predicted and Observed Answering Behavior
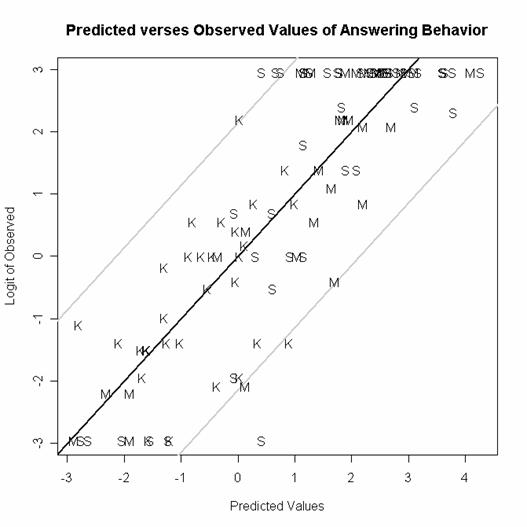
Note: Points are plotted with letters representing group membership (K=Kites, S=Server, M=Matlab). The gray lines are two standard deviations from the line of perfect association of predicted with observed.
The distribution of points for all three groups along the predictive diagonal indicates that the model effectively predicts answering behavior for all three newsgroups. We are encouraged that the metrics can predict level of answering rather well in Kites despite the fact that it is not primarily a technical newsgroup. This bodes well for extending the signatures strategy to more discussion oriented newsgroups. The absence of cases in the extreme lower right and upper left areas indicates that the metrics do not make major errors, suggesting that the metrics are not systematically mischaracterizing some subset. An important methodological lesson is suggested by the points concentrated in the upper and lower bounds of the figure where levels of answering reached the maximum observed value. This indicates that the predictive potential of the model can be further improved by sampling more actions. As the number of sampled messages increases the probability of observing occasional deviations from role behavior will increase, but this increase should be attenuated by degree of investment in that role.
Discussion
This research lays the foundation for more systematic testing of signatures of social roles in online discussion spaces, as well as suggesting directions to improve measurement of the signatures, better estimation techniques, and strategies for automating role detection. Based on our preliminary results we believe that answer people in online discussion spaces will be likely to lightly touch threads initiated by others, be disproportionately tied to relative isolates, have few intense ties and few triangles in their local networks. Further, we believe that these attributes should be more strongly predictive of role behavior where there are a high proportion of transient participants. While these claims need to be supported with more extensive testing, they link well with our practical understanding of answering behavior.
There are several obvious steps for improving the measurement of the variables. First, future studies will require research assistants, naïve to premise of study, for content analysis to construct the dependent variable to guard against bias and to allow testing of inter-coder reliability. Second, we need metrics that can replace the subjective coding of the authorlines. While authorlines are helpful for recognizing patterns, quantitative measures are necessary for systematic testing and ultimately for automation of role predicting software. We are most satisfied with the measurement of neighbor’s degree distribution, which efficiently captured a dramatic feature of the answer person role. However, our measurement of local network attributes was a simple index that coded whether an actor was above or below average on each of three network attributes. There are several directions to explore for improving this measure, and we exploring a couple of strategies that can provide approximate classification of local network types, such as fixed order Markov graphs or a variation of the P* strategy employed by Skvoretz and Faust (2002). In the analysis we noted that uncertainty about role was greatest for actors with few messages. The obvious strategy would be to collect more data, although this is not always possible. However, estimation of roles for low signal individuals could be improved by inferring their role partly by their relationships to alters whose role status is either known, or is estimated with a high probability. Thus an author with a few ties to alters with a high probability of being answer people is likely an answer seeker.
Using Signatures to Find Roles. We would like to extend the answer person investigation to other newsgroups and to develop signatures that highlight other roles as well. We have evidence that these metrics worked well for these three groups but we need to test them more widely and across a range of time periods. The more widely the signatures can be applied and still predict well, the more confident we can be that the signatures pick up on important aspects of the answer person role. In on-going work, we are collecting data from 45 additional Usenet newsgroups, including fifteen computing newsgroups, and five more from each of several topics including politics, science, recreation, support, fan, and flame newsgroups. Data are being collected in month long increments for a period of five months. This will allow us to expand the test of the answer person role, explore for signatures of different types of discussion people, and track change in roles across time. These expansions will help address the question of how well these signatures can identify roles across time and social space.
Our broader goal is to construct a taxonomy of social roles and author types in online discussion spaces. Once we can reliably identify a set of roles we can move to a broader analysis of the variation of newsgroups and other similar kinds of discussion spaces based on the relative proportion of each type of role found to be present in the space. This method should enable a systematic categorization of the range of variation in online discussion spaces. Such an approach may allow for the automatic characterization of both participants and their discussion environments.
Implications Online. Our goal has been to identify roles structurally, while building on insights gained from more ethnographic and exploratory methods. By focusing our analysis on relatively simple measures we have identified strategies for identifying players of different roles that can be applied informally by users of discussion spaces or by list managers. Does this person typically contribute lightly to threads initiated by others? Does this person tend to reply to alters who already have many ties?
While our data currently are limited to Usenet, the notion of social roles in public spaces is not exclusive to this setting. This structural signature approach might be fruitfully applied to mailing lists, other discussion forums, blogs, and to wikis. A list manager might, for example, use an email network analysis program to characterize roles people play in personal email lists. Recent email analysis tools (Neustaedter, Brush, Smith, and Fisher 2005) are now assembling the databases necessary to apply these signatures. The same strategy of inferring roles from structural attributes could also be applied to collaborative systems like Flickr and Wikipedia. In Wikipedia, such techniques might improve the ability of researchers to estimate the quality of articles by leveraging the structural attributes of the contributors.
To the extent that signature based techniques can successfully identify answer people, the methods can be used to evaluate the success of strategies intended to cultivate roles. Researchers, who study communities of practice, could use structural and behavioral signatures to generated pre and post test indicators of role behavior—and thus measure the impact of the changes in designs or practices intended to cultivate desired outcomes.
Conclusion
This paper makes three sorts of contributions in the effort to deduce roles from structural and behavioral signatures. First, we describe visualization strategies that illustrate patterns of contribution that we propose are a proxy for indicators of social roles. Second, we document relationships between these signatures and the performance of roles in online discussions, paying special attention to signatures that distinguish general discussion from the provisions of valuable advice and answers, “answer person” role. Third, we provide a foundation for leveraging structural and behavioral data to identify valuable contributors to online discussion groups and to potentially identify signatures for other social roles.
We conclude with two general claims: (1) visualization is a productive way to identify signatures of social roles; and (2) social roles in online settings should be studied through the intersection of multiple methods. Visualization should be an important method for the development of intuitions and the recognition of patterns in social network analysis (Brandes, Raab and Wagner 2001; Freeman 2000). Those intuitions can be formalized into metrics and tested via systematic comparison. So far, not enough work has brought these two parts together. Rather than using off-the-shelf metrics, for example, the many forms of centrality measures, the work of prominent network researchers suggests that metrics should be purpose built to reveal the social process or social structure of interest (Burt 1992). We think this is a good direction and believe that beginning from egocentric network based statistics is a good way to study social roles. Finally, progress in our ability to study roles will require integration of multiple methods, and increasingly, collaboration that bridges social, information and computer sciences. The explosion of computer mediated systems for social interaction is leading to a proliferation of high dimensional datasets. Leveraging the potential of that data to reveal the hidden structure of social interaction will require the aggressive integration of network, behavioral, and content data. This paper demonstrated one important direction for this research: using data visualization to identity structural signatures of social roles.
References
Brandes, U., Erlebach, T. ed. 2005. Network Analysis: Methodological Foundations. Springer.
Brandes, U., Raab, J., Wagner, D. 2001. “Exploratory Network Visualization: Simultaneous Display of Actor Status and Connections.” Journal of Social Structure 2 (4). Available: http://www.cmu.edu/joss/content/articles/volume2/BrandesRaabWagner.html.
Burkhalter, B. and Smith, M. 2004. "Inhabitant’s Uses and Reactions to Usenet Social Accounting Data." In Inhabited Information Spaces. Edited by D. N. Snowden, E. F. Churchill, and E. Frecon, pp. 291-305. London: Springer-Verlag.
Burt, R. S. 1992. Structural Holes: The Social Structure of Competition. Cambridge, MA: Harvard University Press.
Burt, R. S. 2004. "Structural Holes and Good Ideas." American Journal of Sociology 110: 349-399.
Callero, P. L. 1994. "From Role-Playing to Role-Using: Understanding Role as Resource." Social Psychology Quarterly 57: 228-243.
Coleman, J. S. 1990. Foundations of Social Theory. Cambridge, MA: Harvard University Press.
Cortes, C., Fisher, K., Pregibon, D., Rodgers, A., Smith, F. 2004. "Hancock: A Language for Analyzing Transactional Data Streams." ACM Transactions on Programming Language and Systems 26: 301-338.
Cortes, C., Pregibon, D. 2001. "Signature-Based Methods for Data Streams." Data Mining and Knowledge Discovery 5: 167-182.
Donath, J. S. 1996. “Identity and Deception in the Virtual Community.” In Communities in Cyberspace, pp. 29-59. Edited by P. Kollock & M. Smith. London: Routledge.
Donath, J. S. 1999. “Visualizing Conversation.” Journal of Computer-Mediated Communication 4 (4).
Erickson, B. H., Nosanchuk, T. A. 1984. “The Allocation of Esteem and Disesteem: A Test of Goode's Theory.” American Sociological Review 49 (5): 648-658.
Erickson, T., Herring, S. 2005. “Persistent Conversation: A Dialog Between Research and Design.” Proceedings of the 38th Hawaii International Conference on System Sciences (HICSS 2005). IEEE Press.
Faust, K., Skvoretz, J.. 2002. "Comparing Networks Across Space and Time, Size and Species." Sociological Methodology 32: 267-299.
Fehr, E., Fischbacher, U. 2003. “The Nature of Human Altruism.” Nature 425: 785-791.
Freeman, L. C. 2000. "Visualizing Social Networks." Journal of Social Structure 1 (1). Available: http://www.cmu.edu/joss/content/articles/volume1/Freeman.html.
Fisher, D., Smith, M., Welser, H. T. 2006. “You Are Who You Talk To: Detecting Roles in Usenet Groups.” In Proceedings of the 39th Hawaii International Conference on Systems Sciences (HICSS), January 4-7. Computer Society Press.
Gilbert, P. 1990. “Changes: Rank, Status and Mood.” In On the Move: The Psychology of Change and Transition. Edited by S. Fischer and C. L. Cooper, pp. 33-52. New York: Wiley.
Golder, S. A. 2003. A Typology of Social Roles in Usenet. Unpublished Senior Honors, Harvard University, Cambridge, MA.
Guseva, A., and Rona-Tas, A. 2001. "Uncertainty, Risk, and Trust: Russian and American Credit Card Markets Compared." American Sociological Review 66: 623-646.
Hanneman, R., Riddle, C. 2005. Introduction to Social Network Methods. Riverside, CA: University of California, Riverside. Available at http://faculty.ucr.edu/~hanneman/.
Haythornthwaite, C., Hagar, C. (2005). “The Social World of the Web.” Annual Review of Information Science and Technology 39: 311-346.
Herring, S. C. 2004. “Slouching Toward the Ordinary: Current Trends in Computer-Mediated Communication.” New Media & Society 6 (1): 26-36.
Howard, P. N. 2002. “Network Ethnography and the Hypermedia Organization: New Media, New Organizations, New Methods.” New Media & Society 4 (4): 550-574.
Lampe, C., Resnick, P. 2004. “Slash(dot) and Burn: Distributed Moderation in a Large Online Conversation Space.” CHI
Lerner, J., Tirole, J. 2002. "Some Simple Economics of F/OSS." Journal of Industrial Economics 52:197-234.
Lesser, E. L., Storck, J. 2001. "Communities of Practice and Organizational Performance." IBM Systems Journal 40: 831-841.
Marcoccia, M. 2004. "On-line Polylogues: Conversation Structure and Participation Framework in Internet Newsgroups." Journal of Pragmatics 36: 115-145.
Merton, R. K. 1968. Social Theory and Social Structure.
Mizruchi, M. S. 1993. "Cohesion, Equivalence, and Similarity of Behavior: A Theoretical and Empirical Assessment." Social Networks 15: 275-307.
Moghaddam, F. M. 1998. Social Psychology: Exploring Universals across Cultures.
Nadel, S. F. 1964. Theory of Social Structure.
Neustaedter, C., Brush, A. J., Smith, M., Fisher, D. 2005. The Social Network and Relationship Finder: Social Sorting for Email Triage. CEAS.
Olson, M. 1971. The Logic of Collective Action; Public Goods and the Theory of Groups.
O'Madadhain, J., Fisher, D., White, S., Boey, Y. 2003. “The JUNG (Java Universal Network/Graph) Framework.” Technical Report UCI-ICS 03-17.
Ostrom, E. 1991. Governing the Commons: The Evolution of Institutions for Collective Action.
Parsons, T. 1951. The Social System.
Pfaffenberger, B. 2003. "A Standing Wave in the Web of Our Communications: Usenet and the Socio-Technical Construction of Cyberspace Values.” In From Usenet to Cowebs. Edited by C. Lueg & D. Fisher, pp. 20-43.
Sack, W. 2002. "What Does a Very Large-Scale Conversation Look Like? Artificial Dialectics and the Graphical Summarization of Large Volumes of E-mail." Leonardo 35 (4): 417-426.
Skvoretz, J., Faust, K. 2002. "Relations, Species, and Network Structure." Journal of Social Structure 3 (3). Available: http://www.cmu.edu/joss/content/articles/volume3/SkvoretzFaust.html.
Smith, M. A. 2003. "Measures and Maps of Usenet." In From Usenet to Cowebs. Edited by C. Lueg & D. Fisher, pp. 47-78.
Turner, T. C., Smith M., Fisher, D., Welser H. T. 2005. “Picturing Usenet: Mapping Computer-Mediated Collective Action.” Journal of Computer Mediated Communication 10 (4).
Viegas, F. B., Smith, M. A. 2004. Newsgroup Crowds and Author Lines: Visualizing the Activity of Individuals in Conversational Cyberspaces. Big Island, HI: IEEE.
Wasserman, S., Faust, K. 1994. Social Network Analysis.
Weber, S. 2004. The Success of Open Source.
Wellman, B., Salaff, J., Dimitrova, D., Garton, L., Gulia, M., Haythornthwaite, C. 1996. “Computer Networks as Social Networks: Collaborative Work, Telework, and Virtual Community.” Annual Review of Sociology 22: 213-238.
Wellman, B. 2001. "Computer Networks as Social Networks." Science 293 (5537): 2031-2034.
Welser, H. T. 2006. A Theory of Status Achievement. Unpublished Dissertation,
Wenger, E. 1999. Communities of Practice: Learning, Meaning, and Identity.
Wenger, E., McDermott, R. A., Snyder, W. 2002. Cultivating Communities of Practice: A Guide to Managing Knowledge.
Wenger, E., Snyder, W. 2000. "Communities of Practice: The Organizational Frontier." Harvard Business Review: 139-145.
White, H. C., Boorman, S. A., Ronald L. Breiger. R. L. 1976. "Social-Structure from Multiple Networks: 1. Blockmodels of Roles and Positions." American Journal of Sociology 81 (4): 730-780.
Winship, C. 1988. "Thoughts About Roles and Relations: An Old Document Revisited." Social Networks 10: 209-231.