Exploratory Network Visualization:
Simultaneous Display of
Actor Status and Connections 1
Ulrik Brandes2 ĀĀĀ J÷rg Raab3 ĀĀĀ Dorothea Wagner4
Ā
Abstract: We propose a novel visualization approach that facilitates graphical exploration and communication of relative actor status in social networks. The main idea is to map, in a drawing of the entire network, actor status scores to vertical coordinates. The resulting problem of determining horizontal positions of actors and routing of connecting lines such that the overall layout is readable is algorithmically difficult, yet well-studied in the literature on graph drawing. We outline a customized approach.
The advantages of our method are illustrated in a study of policy making structures from the privatization processes of former East German industrial conglomerates, in which the visual approach led to additional findings that are unlikely to have been revealed using non-visual means of analysis.
Printable versions of this article are
available in g'zipped PostScript
(190ĀKB), and PDF (670ĀKB).
For many figures, an SVG version can be obtained by
clicking on them.
Ā
1ĀIntroduction
From the very beginning, visualization has been an essential tool in the analysis of social networks. In his groundbreaking work, Moreno (1953) relied extensively on graphical representations, and there is hardly any mentioning of alternatives to visual analysis of sociometric data. In fact, he attributes the breakthrough of the sociometric movement to a showing of sociometric charts at theĀ1933 convention of the Medical Society of the State of New YorkĀ(1953, p.Āxiii).
While early network analysis was largely based on plausible, yet informal, concepts and qualitative data exploration, a wealth of formal concepts has been subsequently developed to provide quantitative empirical evidence for substantive research questions. For a comprehensive overview of such methods see Scott (2000) or Wasserman and Faust (1994). Sadly, visualization techniques have not kept up with this progress in measurement, leading to a divergence of analysis and graphical presentation that can be traced through the history of social network visualization (Klovdahl, 1981; Brandes et al., 1999; Freeman, 2000).
While today visualizations are used to present network data, quantitative results of network analyses are still typically given in tabular form. However, aggregate indices in general are insufficient to fully appreciate and understand the structural information contained in network data. In network analysis, it is therefore desirable to integrate graphical presentation of the actual network and results from quantitative analyses.
Many types of networks are traditionally visualized using point-and-line representationsĀ(Bertin, 1983). Since few networks have an underlying spatial layout, their elements need to be positioned in some other meaningful way. While the tedious work of manually positioning the elements is out of the question even for small to medium-size networks, the primary design principle implemented in currently available software for automatic layout is clarity. That is, the focus is on readability rather than visual communication of substantive content.
In addition to the inherent difficulty of laying out an abstract network in a readable way (see DiĀBattista etĀal., 1999, or Kaufmann and Wagner, 2001, for overviews of algorithms for the visualization of networks in general), there is also the issue of confidence. Who is going to comfortably draw conclusions from complex aggregate data, if it is difficult to relate them to the original network data and if it is unclear how much the drawing of the network leads to wrong impressions and succeedingly to wrong interpretations?
We argue that it is both useful and feasible to reintegrate formal network analysis and graphical presentation. Our approach is to contextualize analytic results with the underlying network data by parameterizing the graphical design of visualizations with structural properties. In other words, we want to `explain' derived quantities by showing them simultaneously with the data in a single diagram. To be effective, such diagrams must be grounded on some express design principles. We thus follow recommendations from Tufte (1997).
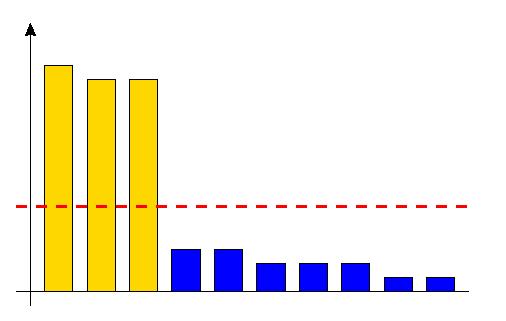
A simple example of explanatory visualization of attribute data is the depiction of a mean as a horizontal line through a bar chart of its constituent values. Since the mean as the aggregate index can result from quite different data, showing the data together with the index can be viewed as an explanation of the latter.
ĀĀ Figure 1: Simultaneous display of data points and their mean value
More sophisticated examples of visualization strategies that could be called explanatory are mostly concerned with clustering. The common design principle used to convey a semantic (given) or syntactic (structural) clustering is spatial proximity supported by delineation of cluster boundaries or shading of cluster backgrounds (see, e.g., Frank 1996; Krempel 2000; de Nooy etĀal. 2000). The only explanatory visualization of exact actor indices that we know of is the mapping of structural centrality to geometric centrality introduced in Brandes etĀal. (1999b). In the present paper, we propose a corresponding method for explanatory visualization of status indices.
By appropriate formalization and using advanced algorithms, explanatory visualizations can be produced automatically, thus shifting the production of information-dense, yet readable, network graphics from the artistic to the scientific domain, the implications being increased reliability and easy reproducibility.
The benefits of automatically produced visualizations based on substantive perspectives are two-fold: On the one hand, they facilitate effective communication of findings, but on the other hand they also facilitate graphical exploration of network data. In this paper, our focus is on the second aspect. The argument is illustrated by a study of policy making structures, in which the visual approach led to additional findings that are unlikely to have been revealed using non-visual means of analysis. One in-depth rather than a series of superficial examples is chosen to demonstrate how substantive research questions - in this case about political decision processes - are connected to design principles to form an explorative visualization tool for the analysis.
The paper is organized as follows. In SectionĀ2, we develop a graphical design for explanatory visualization of networks and status therein. An algorithm to produce such drawings is outlined in SectionĀ3. In SectionĀ4, we demonstrate the advantages of graphical status exploration by presenting a study of policy networks, in which the power structure of actors involved in the privatization processes of the former East German steel and shipbuilding industries is investigated. Several conclusions are offered in SectionĀ5.
Ā
2ĀGraphical Design of Status Visualizations
The goal of this work is to provide automatic visual support for systematic status exploration in social networks. To our knowledge, until now such analysis has not been performed using automatically produced diagrams, presumably because of a lack of visualization principles that are general enough to facilitate unbiased interpretation. There are three main aspects such principles need to address (Brandes etĀal., 1999a): the substantive content to be visualized, the graphical design, and the algorithm realizing it. Substance and design are described in this section, and a corresponding algorithm is sketched in the next.
When exploring his hand-drawn sociograms, Moreno (1953) used a very simple concept of status, sociometric choice, which would now be called weighted indegree. Since its constituent factors are simply the choices an actor receives from alters, sociometric choice is a local measure and hence easily recognized in point-and-line diagram. Therefore, no sophisticated design of a sociogram is required to visualize choice status.
| Figure 2: Historical example of a status-ordered network (Whyte, 1943) |
 |
| Figure 3: Historical example of a status-ordered matrix with high-status actors (classĀI) at the top and to the left, and low-status actors (classĀV) at the bottom and to the right. Instead of showing them individually, the total number of choices in each block is given. Note the tendency to choose actors with higher status (adapted from LongmoreĀ1948) |
 |
InĀWhyte (1943), status is an extrinsic property of network actors, but Whyte nevertheless integrates it in the design of several sociograms by arranging actors vertically so that positions indicate relative actor status. As can be seen in the example shown in FigureĀ2, status is communicated quite effectively. It should be noted, however, that the network does not form the basis for this hierarchy, since status is determined by other factors. In this sense, the visual hierarchy and the network are independent, but it is a conclusion that can be drawn from the visualization that connections rarely exist between actors of significantly different status.
Similarly, LongmoreĀ(1948) introduces a semantic status attribute into matrix representations by ordering actors along the diagonal according to their rank, with the highest-ranking actors in the upper left and lowest-ranking actors in the lower right corner. Status classes thus correspond to blocks along the diagonal (FigureĀ3). Loomis and PowellĀ(1949) adapt this design to sociograms in which classes correspond to horizontal stripes, again with high-status classes shown above low-status classes. Positions within a class are determined to reduce visual noise caused by connecting lines.
| Figure 4: Sociometric choice status of a focal actor (Northway, 1954) |
 |
The first and only attempt we know of to simultaneously visualize structurally defined status and connections determining it, is from NorthwayĀ(1954). She also uses horizontal stripes, but to indicate the quartile in which the sociometric choice status of an actor lies. However, only a focal actor and its alters are shown, probably because the arrangement of an entire network in this fashion is too cumbersome. Note that positioning of actors and routing of connections had to be carried out by hand in all of the above visualization procedures.
The first non-trivial formalization of structural status in a network is attributed to Katz (1953), who developed an index that takes into account not only direct choices made by alters, but also indirect choices by other actors. The result is a number assigned to each actor, indicating relative status in the network. However, this is exactly where formal analysis and visual exploration begin to diverge. Incidentally, Katz is also a prominent figure arguing in favor of representing networks by matrices rather than sociograms (1947).
| Figure 5: Formal organizational chart and adjacency matrix of advice relationship. A matrix entry ofĀ1 indicates that the row actor turns to the column actor for advice | ||||||||||||||||||||||||||||||||||||||||||||||||||||||||||||||||||||||||||||||||||||||||||||||||||||||||||||||||||||||||||||||||||||||||||||||||||||||||||||||||||||||||||||||||||||||||||||||||||||||||||||||||||||||||||||||||||||||||||||||||||||||||||||||||||||||||||||||||||||||||||||||||
 |
||||||||||||||||||||||||||||||||||||||||||||||||||||||||||||||||||||||||||||||||||||||||||||||||||||||||||||||||||||||||||||||||||||||||||||||||||||||||||||||||||||||||||||||||||||||||||||||||||||||||||||||||||||||||||||||||||||||||||||||||||||||||||||||||||||||||||||||||||||||||||||||||
|
||||||||||||||||||||||||||||||||||||||||||||||||||||||||||||||||||||||||||||||||||||||||||||||||||||||||||||||||||||||||||||||||||||||||||||||||||||||||||||||||||||||||||||||||||||||||||||||||||||||||||||||||||||||||||||||||||||||||||||||||||||||||||||||||||||||||||||||||||||||||||||||||
The difficulty of recognizing aggregate data in the absence of diagrams that explicitly represent them is nicely illustrated in a story from Krackhardt (1996), which we now use as an example to motivate our own approach. Krackhardt analyzed a group of 14Āemployees, the internal auditing staff of a large company. The group's formal organization is compared to an informal relation called `advice,' i.e. who does an actor turn to for help or advice at work about work-related questions or problems? Organizational and advice relation data are given in FigureĀ5.
Commonly used network visualization tools such as PajekĀ(Batagelj and Marvar, 1998), KrackPlotĀ(Krackhardt etĀal., 1994), or MultiNetĀ(Richards and Seary, 1999) are designed to produce general purpose visualizations focusing on the ease of perceiving connectedness information (i.e. the presence or absence of links between pairs of actors), or inherent symmetry. Node positions are typically determined using variants of the spring embedder (Eades, 1984), multidimensional scaling, or eigenvectors of network-related matrices such as the adjacency or Laplacian matrix. PajekĀ(Batagelj and Marvar, 1998) provides the option to fix one or more dimensions of the layout space, e.g.Āby mapping one or more node indices to coordinates, but currently has no dedicated algorithm to produce readable visualizations given such constraints. Since the result of the status analysis cannot be taken into account with the common layout algorithms, status indices need to be represented by the size of nodes, by numerical labels, or separate from the drawing as in FigureĀ6.
| Figure 6: Non-explanatory automatic visualization of advice network and Katz's status index (spring-embedder type network layout and stem-and-leaf diagram) | |||||||||||||||||||||||||||||||||||||||||||
 |
|
||||||||||||||||||||||||||||||||||||||||||
Though the network diagram is very readable, it does not convey the interesting substantive information. Moreover, its design is inherently undirected (the picture would be the same even if some or all of the edge directions were reversed), and it is next to impossible to relate the status scores to the picture. Assume, for instance, we swap the status scores of Nancy and Manuel; the visualization would not provide any indication that something was wrong.
This is in stark contrast to empirical evidence suggesting that network layout not only affects the ease of reading (Purchase etĀal., 1997), but has an influence on the understanding and interpretation of substantive content as well (McGrath etĀal., 1997). Consequently, Krackhardt (1996) arranged the actors so that most nominations point in an upward direction, thus creating an informal advice hierarchy that yields an implicit notion of status (see FigureĀ7).
| Figure 7: Advice network, manually arranged so that most nominations are upward (adapted fromĀKrackhardt 1996) |
 |
The advice hierarchy largely resembles the formal organizational hierarchy, with one notable exception. Confronted with the graphical evidence, the manager concluded that changes he introduced to increase through-put may have been ineffective because he had not made sure that the secretary presiding the informal hierarchy of advice was backing them (Krackhardt, 1996, p.Ā166f).
Though it works fine in this particular example, note that the above rule for vertical arrangement is error-prone in general, since the requirement of a maximum number of upward oriented connections may result in misleading visual explanations. A simple example of this kind is a network of actors whose connections form a directed cycle. Any one connection can be chosen as the single downward oriented one, but each choice results in a different vertical ordering of the actors. See the paragraph on layer assignment in SectionĀ3 for more details on this problem.
Krackhardt's visualization is based on the same principle as Whyte's in FigureĀ2 and Northway's in FigureĀ4. While using different concepts of status, they all refer to the everyday notion of `higher' and `lower' status by mapping status to vertical positions. These approaches have, however, two limitations that need to be overcome: First, the mapping of status to vertical positions is somewhat arbitrary, since there are no guidelines on how to determine the exact vertical position from a status classification or relative ordering; and, second, horizontal positions serving to produce a readable drawing are determined manually.
| Figure 8: Explanatory visualization of Katz's status index in Krackhardt's advice network. Scores range fromĀ0% toĀ26.54%, and solid horizontal lines indicate aĀ5% increase |
 |
We overcome these limitations, and thereby reintegrate formal analysis and graphical presentation, by placing actors at vertical positions that exactly represent their status score, and by determining horizontal positions algorithmically in such a way that the overall visualization is readable.
The idea is illustrated in FigureĀ8, where actors are assigned y-coordinates that represent exactly their Katz status score in the network. Note how the vertical ordering differs from that in FigureĀ7. While the stem-and-leaf diagram of FigureĀ6 does indicate this fact as well, the visualization also explains the reason why: the definition of Katz's status index implies that Nancy's sole nomination of Donna results in Donna's status being higher than Manuel's.
In principle, any definition of status, be it structural or external, can be used in this approach, provided it translates into numerical values specifying y-coordinates. We refer the reader to ChapterĀ5 of Wasserman and Faust (1994) for an overview of structural status concepts, but as already pointed out for the criterion of upward pointing links, we caution that not every definition leads to reliable explanations.
Some additional information is given in the
visualization of FigureĀ8
by depicting actors with ellipses rather than circles. This way,
the ratio of incoming and outgoing links is incorporated into the
drawing without changing the layout. Let in(a) and out(a)
denote the in- and outdegree, i.e. the number of incoming and
outgoing connections, of an actor a. Then, a horizontal
radius h(a) and a vertical radius v(a)
for the ellipse are chosen to satisfy  so that the ratio of in- and outdegree
is visually represented by the ratio of height and width, and the
sum of the degrees is represented by the area of the node. A
minimum height and width is used for zero in- and/or outdegree,
and simple adjustments of the second equation account for node
shapes other than ellipses (rectangles, rhombs, etc.).
so that the ratio of in- and outdegree
is visually represented by the ratio of height and width, and the
sum of the degrees is represented by the area of the node. A
minimum height and width is used for zero in- and/or outdegree,
and simple adjustments of the second equation account for node
shapes other than ellipses (rectangles, rhombs, etc.).
Other than substantive, there are ergonomic criteria visualizations should satisfy. For example, a large number of crossing lines makes a drawing difficult to read (Purchase etĀal., 1997). Visualizations like the one in FigureĀ8 are therefore more difficult to produce than, e.g., bar charts, because we can not just place actors at the specified y-coordinates with some trivially determined x-coordinates. An algorithm to generate readable drawings under the substantive constraint of status mapped to vertical positions is described in the next section.
Ā
3ĀAutomatic Layout
To automatically generate layered visualizations of social networks, it is not sufficient to require actors to lie on a horizontal line with a given y-coordinate (representing the actor's status). We also have to provide an algorithm to compute x-coordinates for actors, and bend points for connections in the network. This is a special case of a graph drawing problem, where a graph is a collection of vertices or nodes (here representing the actors) and edges or lines (here representing the connections between actors). DiĀBattista etĀal. (1999) andĀKaufmann and Wagner (2001) provide good overviews of the field.
The most commonly used framework for horizontally layered drawings of graphs is presented in Sugiyama etĀal. (1981). It consists of the following generic steps:
- determine a layer for each node,
- subdivide each connection by bend points at each layer it crosses and determine, within each layer, the relative ordering of nodes and bend points, and finally
- assign x- and y-coordinates to each node or bend point.
StepsĀ2 andĀ3 are separated to enable the use of combinatorial methods in the second step, which serves to reduce the number of crossing lines. Note that crossings severely affect the readability of a drawingĀ(Purchase, 1997), and that the number of crossings between two adjacent layers is fully determined by the relative ordering of nodes and bend points, independent of the actual coordinates (hence the introduction of bend points, see FigureĀ9).
There is a whole range of implementations, the most widely used being the dag system (Gansner etĀal., 1988). Since, however, we do not know of an available system which applies the Sugiyama approach to layered graphs with pre-specified vertical coordinates, we will outline a customized variant. Comprehensive overviews of other approaches to carry out the above steps are given in ChapterĀ9 of DiĀBattista etĀal. (1999) and Bastert and Matuszewski (2001).
| Figure 9: A three-layer graph with many crossing lines, and the same graph after subdivision of lines at layers and reordering of nodes and bend points. Note that bend points are not shown in the final visualization |
 |
Layer assignment. A fairly common approach to layering is to break all directed cycles, if any, by temporarily reversing some connections, and to assign nodes to layers by topological sorting. Reversing the minimum number of connections nicely corresponds to finding a layering with a maximum number of upward pointing arcs.
Though intuitively an appealing idea and successfully employed in Krackhardt's drawing of the advice network, it should not form the basis of automatically generated status visualizations. There are three substantive arguments against this approach if we are to support exploratory data analysis.
Firstly, the implicit definition of status (directed lines imply that the receiver has a higher status than the sender) yields only a partial ordering, whereas y-coordinates impose a complete ordering. Secondly, a minimum cardinality set of cycle breaking connections need not be unique, thus only one of potentially many equally valid interpretations is suggested. Just consider a network consisting of a directed cycle only. And thirdly, the problem of determining such a set with minimum cardinality is NP-hardĀ(Karp, 1972), i.e.Ālikely to be computationally intractable. The results of any heuristic or approximation algorithm suffer from the same problem encountered for multiple optimal solutions, namely a potential multitude of contradictory results, and an uncertainty of whether the suggested interpretation is granted.
| Figure 10: Misleading layout of Krackhardt's advice network resulting from a standard layer assignment procedure |
 |
As an illustration, consider the layered drawing of the advice network in FigureĀ10, which was produced using a standard instance of the Sugiyama framework with a heuristic layer assignment procedure implemented in the AGD library of algorithms for graph drawingĀ(Mutzel etĀal., 1998). By all means, the resulting visualization is readable. Substantively, however, it is grossly misleading, because it would have suggested to Manuel that he is well in control of his auditing group.
In summary, all three of the above aspects thus introduce arbitrariness into the complete ordering of actor status that a layering implies. Interpretation of relative status becomes unreliable, if not impossible, in visualizations based on a maximum number of upward pointing arcs, and only one notion of status is supported.
Assuming that formal status indices have a sound theoretical basis (a discussion of the appropriateness of an interval scale measurement is beyond the scope of this paper), any such index can be used for the y-coordinate of each node (subject to scaling) and thus also to determine a layering. A trivial layer assignment is to partition the nodes into sets of equal status, and place each set in its own layer, vertically ordered with respect to the status index. Status values often differ only marginally, though, leading to very close layers that cause perceptual problems like, e.g., several crossing (or non-crossing?) line segments running almost horizontally (see FigureĀ11). To avoid such problems, status values are clustered and all vertices with status values in the same cluster are assigned to the same logical layer (without changing their y-coordinates). Though any clustering may be used, the examples in this paper were prepared with an agglomerative clustering scheme starting with singletons and merging two layers, if the minimum status difference between any pair of nodes in different layers is below some threshold depending on the number of nodes in the network.
| Figure 11: Readability problems caused by very close layers |
 |
Crossing reduction. In this step, we are given a layering of the nodes and introduce bend points where lines need to cross a layer. Our goal is to find horizontal orderings of nodes and bend points in each layer such that the number of crossing lines is small. Note that the number of crossings depends only on the ordering, not the actual coordinates.
Finding an ordering that minimizes the number of crossing lines is another NP-hard problem (Garey and Johonson, 1983), but this time it only affects readability rather than interpretation. A common heuristic is the layer-by-layer sweep, in which the ordering in, say, the first layer is fixed and the second layer is reordered to reduce the number of crossings. Then, the order in the second layer is fixed, and the third layer is reordered, and so on. After reaching the last layer, the process is reversed and repeated up and down the layering until it does not yield further improvement. Note however, that even minimizing the number of crossings between neighboring layers, where the ordering in one layer is fixed, is NP-hardĀ(1994).
In practice, the two-layer problem can be solved optimally for medium-size instances using a computationally involved method (J³nger and Mutzel, 1997). Since in general the overall number of crossing will not be minimum anyway, we use the simpler barycenter heuristic, placing a node at the average position of its neighbors in the next layer, to obtain an initial ordering. Then, global siftingĀ(Matuszewski etĀal., 1999) is applied to further reduce the number of remaining crossing. Roughly speaking, global sifting picks one node at a time and finds the locally optimal position within a layer by probing all of them. In combination, these heuristics perform quite satisfactory, and our experiences suggest that the additional effort caused by sifting is indeed worth it.
Ā
Horizontal placement. Given y-coordinates, a layering, and an ordering of nodes and bend points within each layer, it remains to compute actual x-coordinates respecting the horizontal orderings. Pleasing visualizations are obtained by ensuring that long lines run vertical as much as possible, and reducing the horizontal distance spanned when it is not. While for this paper we modified an implementation of a fast heuristic fromĀBuchheim etĀal. (2001), we are now moving to a simplified approach (Brandes and K÷pf, 2001).
Ā
In the following section the visualization approach we have presented will be illustrated with an analysis of two policy networks. It will be shown how explanatory visualization can not only be used for communication of data and results but also for the exploration of data that will enable researchers to discover structural properties that could otherwise easily go unnoticed. In order to clarify our arguments it is necessary to give a short description of the research background of the study which represents the substance for the visualization. We will then draw some general conclusions about the visualization of status indices.
Ā
4ĀVisual Exploration of Network Status
The two policy networks presented are conceptualizations of multi-actor systems of public, societal and private organizations that developed during the privatization of two industrial conglomerates in East Germany as part of the economic transformation after German unification inĀ1990. Their privatization is understood as political bargaining processes between a multitude of actors that are connected by several different kinds of ties.
Ā
4.1ĀEmpirical Background and Research Questions
At the heart of the economic transformation in East Germany was a large-scale privatization process. This privatization was foreseen to be carried out by the Treuhandanstalt (THA), a public agency of the federal government. It was the owner of all assets that belonged to the people's property (Volkseigenes Verm÷gen) of the former German Democratic Republic (GDR). Due to its institutional position and its ownership of all companies, it was generally assumed to be one of the most powerful actors in the transformation of East Germany.
The decision as to which investor could acquire which enterprise under what conditions and the question which enterprises should survive at all lay generally in the discretion of the THA. This powerful position was presumably fundamentally altered in the cases of `big politicized privatizations,' e.g. privatizations which gained an enormous and sometimes nationwide importance, because their outcomes affected the future of whole regions. This was basically the case with the industrial megaconglomerates (Kombinate), which regularly represented the economic core in otherwise economically weak regions encompassing tens of thousands of employees who were often geographically highly concentrated.
Intensive and conflict ridden political bargaining processes developed between a multitude of actors around the question what to do with these `dinosaurs of socialist industrial policy' in the future (big politicized privatizations). Among these actors were political as well as private actors from the various administrative levels within the European Union and Germany. The questions what power structure would evolve and which actors would primarily determine the outcome were especially interesting, because the THA was the single dominant actor in the mass privatization cases and these bargaining systems only developed after 1990 encompassing `old' actors in the respective industrial sectors from West Germany and `new' actors in East Germany. The failure of these privatizations could have led to a serious disruption of the whole transformation. They were therefore seen as highly important political cases for the overall transformation strategy and had a high level of priority for the involved actors.
The central research questions of the study therefore were:
- What kind of policy making structures evolved during the decision processes, i.e. what actors would be involved, what coalitions would emerge, etc.
- What were the actors' power positions and the power concentration in these networks?
These questions were studied in two case studies: the privatization of the shipbuilding industry and of a major steel plant (EKO Stahl AG). In the boundary specification process, 27Āactors in the case of the shipbuilding industry and 21Āactors in the case of the steel plant could be identified who sought to directly or indirectly influence the decisions on privatization and restructuring.
In both cases the type of actors were quite similar, sometimes they were even identical in personae. Actors who were part of the bargaining system were the European Commission (General Directorate for Competition), the federal ministries of finance and economics, the federal chancellery, the respective East German state government, parties within the state parliament, the board of directors and the supervisory board of the Treuhandanstalt, the local governments with enterprise sites, the board of directors, supervisory board and the workers' council of the East German enterprise, the metal workers' union, competitors in West Germany and West German state governments with competitors' sites. Therefore, it can be stated that the original governance structures of mass privatizations in which the Treuhandanstalt was the single dominant actor were significantly differentiated in regard to the number, type and functions of the actors.
Ā
4.2ĀSetup of the Analysis
The policy making system was described and analyzed on the basis of several types of ties based on communication, exchange of resources, consideration of interest, etc. In the following, however, we confine ourselves to the analysis of the power structures resulting from `obligation of report' and `consideration of interest' with the help of status visualizations.5
The actors' structural status is used as an indicator for power/influence in policy networks. The status index determined for these networks is from Burt (1982) and was computed using the software program STRUCTURE (Burt, 1991). For unweighted networks, this index assigns each actor a status score that is the weighted average of the status scores of those actors choosing it. The contribution of each chooser is weighted by the inverse of its outdegree. This can be regarded as a very useful operationalization of power or influence in political processes. Power and influence of an actor in a decision process not only differs according to how many other actors take her interests into account but also how much the interests of third actors find their way into a decision process as well. Therefore Burt's power index implemented in STRUCTUREĀ(Burt, 1991) was chosen because it includes this understanding. But it should be re-emphasized here that the visual analysis could be carried out with any index which determines the rank prestige of actors according to some substantive research question.
The structure based on the tie `consideration of interest' is regarded as the final power structure in democratic political decision processes, which is based on elements of influence (centrality in communication networks) and domination/coercion (Knoke, 1990), which was operationalized as the actors' status in the network based on `obligation of report'. Actors who mandatorily receive reports from others usually have the right to judge or give orders to these other actors, thus indicating an asymmetric power position based on coercive elements. In order to focus on the hierarchical layout, `influence' based on centrality is not reported here.
The differentiation/concentration of power can be measured by looking at the hierarchization of the decision system. Unfortunately, unlike the generic network centralization index (Freeman, 1979), no generally applicable network hierarchization index is available. For the purpose of this research, hierarchization is measured using the index suggested in Krackhardt (1994). It is determined by subtracting the ratio of the number of pairs of mutually reachable actors (i.e. those pairs connected by directed paths in either direction), and the number of pairs of connected actors (i.e. those pairs connected by any sequence of links) from one. If all connected pairs are mutually reachable, the level of hierarchization equals zero. If no such pairs exist in a structural constellation, the index equals one and the network forms a perfect hierarchy.
Ā
4.3ĀGraphical Analysis
Status visualizations are given in FiguresĀ12 andĀ13. To reduce clutter due to bidirectional edges and arrow heads, non-downward pointing uni-directional edges are depicted in black, bidirectional edges in green, and downward pointing edges in red. Thus, the existence and direction of a choice is indicated. As application-specific information, the semantic attributes `realms of activity' (government, political parties, unions and associations, corporations) and `level' (local, regional, federal) are represented by color and shape, respectively.
| Figure 12: Status visualizations for shipbuilding industry networks | |||||||||||||||||
| Ā | |||||||||||||||||
(a)Āobligation of report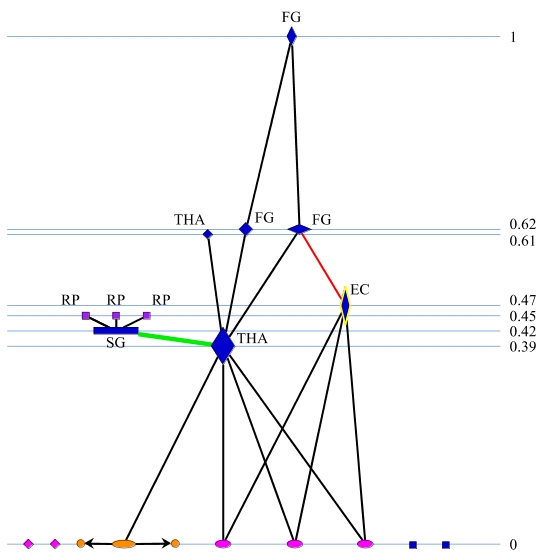
|
|||||||||||||||||
| Ā | |||||||||||||||||
|
|||||||||||||||||
| Ā | |||||||||||||||||
(b)Āconsideration of interest
|
| Figure 13: Status visualizations for steel industry networks | |||||||||||||||||
| Ā | |||||||||||||||||
(a)Āobligation of report
|
|||||||||||||||||
| Ā | |||||||||||||||||
|
|||||||||||||||||
| Ā | |||||||||||||||||
(b)Āconsideration of interest
|
Even without any background knowledge, it is readily observed that fairly coordinated high-level governmental actors (blue rhomboids) dominate the structure in both relations and in both sectors. At the top of the decisive power structure (consideration of interest) in both cases is the board of directors of the privatization agency (THA). This suggests that the formal institutional framework had a great impact in the formation of the decision system, although the positions in the structures of `mandatory report' do not transform directly into the final power structure based on `consideration of interest'.
It seems that especially the administrative actors (blue rhomboids) derive a lot of their power from formal decision rights and competencies, whereas the parties in the state parliaments (RP, purple rectangles) cannot capitalize on their formal rights (a rather low status value in the final power structure), a phenomenon that has been well known and discussed in political science for some time. This knowledge, easily gained from looking at the visualized graphs, could then be used to conduct further analyses about the relationship between the structures based on different types of ties for example by using the QAP procedure.
One can further see that the final power structure was dominated in both cases by actors from the privatization agency (THA), the federal government (FG), the state government (SG) and the European Commission (EC) which very much determined the outcome of both privatization processes. Especially in the decision process of the privatization of the steel plants the administrative actors' interests prevailed against the interests of the West German industrial actors (pink ellipses on the bottom), who called for the closure or further downsizing of the plants.
The hierarchization of the final power structure (`consideration of interest'), and therefore the power concentration, is 53% for shipbuilding and 63% for steel. The hierarchization of the structure based on `obligation of report' for both cases is almost complete (99%). Therefore the formal institutional structure can be regarded as highly hierarchical. Looking more closely at the visualizations of the final power structure (`consideration of interest'), it can be seen that the executive governmental actors (blue rhomboids) formed a powerful coalition and a decision core because they to a large extent mutually considered their interests (green lines). The hierarchization between only these actors isĀ0%. The overall hierarchization is therefore created by private and societal actors considering the interests of the political-administrative ones (black lines bottom to top). In contrast, there are only a few red lines (top to bottom) mainly to the European Commission, the union (WU) and the actors within the East German enterprises (EGE). This gives some indication that the latter two were coopted in the decision process which was confirmed by looking at the overall quantitative and qualitative data.
One can therefore state from the visualizations and the hierarchization indices that a decision system with a medium concentrated power structure developed with the privatization agency remaining the most prominent focal actor, which could ultimately keep control over the processes backed up by the political and administrative actors in the federal and state governments which formed a powerful decision core.
Ā
5ĀConclusion
We have presented an approach for status visualization of network actors. It has been shown how connecting substantive research questions with appropriate design principles and the appropriate algorithms can form a powerful analytic tool for the exploration of social structures. Its greatest advantage clearly lies in the joint representation of raw and aggregate data. Both, links and status positions are visible and can be analyzed together. The visualizations not only improve the communication of results but built on the early practice of using visualizations as an exploratory tool in structural analysis.
In the study presented in the previous section, it would have been much harder if not impossible to detect the decision core and the different zones of hierarchization within the decision system and to make statements about the factors determining the overall level of hierarchization.
A major potential of the presented approach lies in the availability of a macroperspective, because the combined data reveal properties of the whole or parts of the structure and make comparison of network structures much easier:
- The overall hierarchical structure of a system is intuitively visible (positioning and distribution of actors).
- The relative status of different types or groups of actors can be captured quickly. In the analysis of political decision making, coalitions and decision cores can be detected.
- Analysis of what or who causes a system to be hierarchical is possible. Relations and `zones' of non-hierarchy are detected easily. By combining attributes, status scores and relations, brokers and bridges can be detected more readily.
- The comparison between different social systems is much easier. In the two cases presented here it can be easily seen that the structures are very similar in major properties.
Nevertheless, links and position of each actor can also be analyzed in detail. It is possible to analyze which choices cause the position of an actor. Is it only one choice by an actor with a high status score that determines the position or are several choices from actors with lower scores the reason? Is the one actor totally dependent on only one other actor or is her ``power base'' broader? Therefore, in closely analyzing the edges on the micro level the stability of the actors' positions can be determined. Compared to an analysis without visualization, it is also easier to detect possible data entry errors. Because the structure of choices is instantly visible, the researcher has quick access to both raw and aggregate data and can easily check the accuracy, if she has doubts about the position of an actor.
Though our visualizations proved useful in several applications, we feel that a number of details - particularly in regards to bend point placement inside clustered layers - need further improvement. In addition, we would like to provide automatic help for label placement, which has been refined manually for the above examples. We need to further explore means of user interaction: what kind of improvements may users make without running the risk of unconsciously introducing subjective biases?
A major line of future research will be concerned with explanatory visualization of other types of substance, in particular substance that, unlike centrality, status, or clustering, does not have an immediate geometric connotation.
The visone software tool for analysis and visualization of social networks (Baur et al., 2001) makes the approach described in this paper available to the general user.
Ā
Acknowledgments. The data used in SectionĀ2 are courtesy of David Krackhardt. Frank M³ller implemented an early prototype of our layout system in C++ using LEDAĀ(Mehlhorn and Nõher, 1999), AGDĀ(Mutzel etĀal., 1998), and LAPACKĀ(Anderson etĀal., 1999). We thank our referees for useful comments, Rachel Lindsay for careful proof-reading of the manuscript, and Patrick Kenis and Volker Schneider for stimulating discussions on the subject.
Ā
Bibliography
- Anderson, E., Bai, Z., Bischof, C., Blackford, S., Demmel, J., Dongarra, J., DuĀCroz, J., Greenbaum, A., Hammarling, S., McKenney, A., and Sorensen, D. (1999).
- LAPACK
User's Guide.
Society for Industrial and Applied Mathematics, 3rd edition. - Bastert, O. and Matuszewski, C. (2001).
- Layered drawings of digraphs.
In Kaufmann and Wagner (2001), pages 104-139. - Batagelj, V. and Mrvar, A. (1998).
- Pajek - Program for large network
analysis.
Connections, 21(2):47-57. - Baur, M., Benkert, M., Brandes, U., Cornelsen, S., Gaertler, M., K÷pf, B., Lerner, J., and Wagner, D. (2001).
- visone
- Software for visual social network analysis.
In Proceedings of the 9th International Symposium on Graph Drawing (GDĀ'01), Lecture Notes in Computer Science. Springer.
To appear. - Bertin, J. (1983).
- Semiology of Graphics: Diagrams, Networks, Maps.
University of Wisconsin Press. - Brandes, U., Kenis, P., Raab, J., Schneider, V., and Wagner, D. (1999a).
- Explorations into the visualization of policy networks.
Journal of Theoretical Politics, 11(1):75-106. - Brandes, U., Kenis, P., and Wagner, D. (1999b).
- Centrality in policy network drawings.
In KratochvĒl, J., editor, Proceedings of the 7th International Symposium on Graph Drawing (GDĀ'99), volume 1731 of Lecture Notes in Computer Science, pagges 250-258. Springer. - Brandes, U. and K÷pf, B. (2001).
- Fast and simple horizontal coordinate assignment.
In Proceedings of the 9th International Symposium on Graph Drawing (GDĀ'01), Lecture Notes in Computer Science. Springer.
To appear. - Brandes, U. and Wagner, D. (2000).
- Contextual visualization of actor status in social
networks.
In deĀLeeuw, W. and van Liere, R., editors, Data Visualization 2000. Proceedings of the 2nd Joint Eurographics and IEEE TCVG Symposium on Visualization (VisSymĀ'00), pages 13-22. Springer. - Buchheim, C., J³nger, M., and Leipert, S. (2001).
- A fast layout algorithm for k-level graphs.
In Marks, J., editor, Proceedings of the 8th International Symposium on Graph Drawing (GDĀ2000), volume 1984 of Lecture Notes in Computer Science, pages 229-240. Springer. - Burt, R.ĀS. (1982).
- Toward a Structural Theory of Action: Network Models
of Social Structure, Perception, and Action.
Academic Press. - Burt, R.ĀS. (1991).
- Structure, VersionĀ4.2.
Center for the Social Sciences, Columbia University, New York. - de Nooy, W., Batagelj, V., and Mrvar, A. (2000).
- Visual analysis and pre-specified blockmodels.
Paper presented at SunbeltĀXX, Vancouver. - DiĀBattista, G., Eades, P., Tamassia, R., and Tollis, I.ĀG. (1999).
- Graph Drawing: Algorithms for the Visualization of
Graphs.
Prentice Hall. - Eades, P. (1984).
- A heuristic for graph drawing.
Congressus Numerantium, 42:149-160. - Eades, P. and Wormald, N.ĀC. (1994).
- Edge crossings in drawings of bipartite graphs.
Algorithmica, 11:379-403. - Frank, K.ĀA. (1996).
- Mapping interactions within and between cohesive
subgroups.
Social Networks, 18(2):93-119. - Freeman, L.ĀC. (1979).
- Centrality in social networks: Conceptual clarification.
Social Networks, 1:215-239. - Freeman, L.ĀC. (2000).
- Visualizing social networks.
Journal of Social Structure, 1(1). - Gansner, E.ĀR., North, S.ĀC., and Vo, K.-P. (1988).
- DAG - A program that draws directed graphs.
Software--Practice and Experience, 17(1):1047-1062. - Garey, M.ĀR. and Johnson, D.ĀS. (1983).
- Crossing number is NP-complete.
SIAM Journal on Algebraic and Discrete Methods, 4:312-316. - J³nger, M. and Mutzel, P. (1997).
- 2-Layer straightline crossing minimization: Performance
of exact and heuristic algorithms.
Journal of Graph Algorithms and Applications, 1(1):1-25. - Karp, R.ĀM. (1972).
- Reducibility among combinatorial problems.
In Miller, R. and Thatcher, J., editors, Complexity of Computer Computations, pages 85-103. Plenum Press. - Katz, L. (1947).
- On the matric analysis of sociometric choice data.
Sociometry, 10:233-241. - Katz, L. (1953).
- A new status index derived from sociometric analysis.
Psychometrika, 18:39-43. - Kaufmann, M. and Wagner, D., editors (2001).
- Drawing Graphs: Methods and Models, volume 2025
of Lecture Notes in Computer Science.
Springer. - Klovdahl, A.ĀS. (1981).
- A note on images of networks.
Social Networks, 3:197-214. - Knoke, D. (1990).
- Political Networks: The Structural Perspective.
Cambridge University Press. - Krackhardt, D. (1994).
- Graph theoretical dimensions of informal organizations.
In Carley, K.ĀM. and Prietula, M.ĀJ., editors, Computational Organization Theory, pages 89-112. Lawrence Erlbaum Associates. - Krackhardt, D. (1996).
- Social networks and the liability of newness for
managers.
In Cooper, C.ĀL. and Rousseau, D.ĀM., editors, Trends in Organizational Behavior, volumeĀ3, pages 159-173. John Wiley & Sons. - Krackhardt, D., Blythe, J., and McGrath, C. (1994).
- KrackPlotĀ3.0: An improved network drawing program.
Connections, 17(2):53-55. - Krempel, L. (2000).
- Exploring and communicating block models visually.
Paper presented at SunbeltĀXX, Vancouver. - Longmore, T.ĀW. (1948).
- A matrix approach to the analysis of rank and status in a
community in peru.
Sociometry, 11(3):192-206. - Loomis, C.ĀP. and Powell, R.ĀM. (1949).
- Sociometric analysis of class status in rural Costa Rica
- A peasant community compared with an hacienda
community.
Sociometry, 12(1-3):192-206. - Matuszewski, C., Sch÷nfeld, R., and Molitor, P. (1999).
- Using sifting for k-layer straightline crossing
minimization.
In KratochvĒl, J., editor, Proceedings of the 7th International Symposium on Graph Drawing (GDĀ'99), volume 1731 of Lecture Notes in Computer Science, pagges 217-224. Springer. - McGrath, C., Blythe, J., and Krackhardt, D. (1997).
- The effect of spatial arrangement on judgments and errors
in interpreting graphs.
Social Networks, 19(3):223-242. - Mehlhorn, K. and Nõher, S. (1999).
- The LEDA Platform of Combinatorial and Geometric
Computing.
Cambridge University Press. - Moreno, J.ĀL. (1953).
- Who Shall Survive: Foundations of Sociometry, Group
Psychotherapy, and Sociodrama.
Beacon House. - Mutzel, P., Gutwenger, C., Brockenauer, R., Fialko, S., Klau, G.ĀW., Kr³ger, M., Ziegler, T., Nõher, S., Alberts, D., Ambras, D., Koch, G., J³nger, M., Buchheim, C., and Leipert, S. (1998).
- AGD - A
library of algorithms for graph drawing.
In Whitesides, S.ĀH., editor, Proceedings of the 6th International Symposium on Graph Drawing (GDĀ'98), volume 1547 of Lecture Notes in Computer Science, pages 456-457. Springer. - Northway, M.ĀL. (1954).
- A plan for sociometric studies in a longitudinal
programme of research in child development.
Sociometry, 17(3):272-281. - Purchase, H.ĀC. (1997).
- Which aesthetic has the greatest effect on human
understanding?
In DiĀBattista, G., editor, Proceedings of the 5th International Symposium on Graph Drawing (GDĀ'97), volume 1353 of Lecture Notes in Computer Science, pages 248-261. Springer. - Purchase, H.ĀC., Cohen, R.ĀF., and James, M. (1997).
- An experimental study of the basis for graph drawing
algorithms.
ACM Journal of Experimental Algorithmics, 2(4). - Richards, W.ĀD. (1999).
- MultiNet.
Software tool. - Scott, J. (2000).
- Social Network Analysis: A Handbook.
Sage Publications, 2nd edition. - Sugiyama, K., Tagawa, S., and Toda, M. (1981).
- Methods for visual understanding of hierarchical system
structures.
IEEE Transactions on Systems, Man and Cybernetics, 11(2):109-125. - Tufte, E.ĀR. (1997).
- Visual Explanations: Images and Quantities, Evidence
and Narrative.
Graphics Press. - Wasserman, S. and Faust, K. (1994).
- Social Network Analysis: Methods and Applications.
Cambridge University Press. - Whyte, W.ĀF. (1943).
- Street Corner Society.
University of Chicago Press.
Footnotes
- 1
- A preliminary version of part of this work appears in Brandes and Wagner (2000).
- 2
- Department of Computer & Information Science, University of Konstanz, Ulrik.Brandes@uni-konstanz.de. Part of this research was done while with the Department of Computer Science at Brown University. I gratefully acknowledge the German Academic Exchange Service (DAAD/HochschulsonderprogrammĀIII) for financial support.
- 3
- Department of Public Policy & Management, University of Konstanz, Joerg.Raab@uni-konstanz.de. Part of this research was done while with the School of Public Administration and Policy at the University of Arizona. I gratefully acknowledge the Volkswagen Foundation for financial support.
- 4
- Department of Computer & Information Science, University of Konstanz, Dorothea.Wagner@uni-konstanz.de.
- 5
- The links in the first type of tie were constructed on the basis of the formal rules within the German constitution, the laws in the industrial sectors and those relevant for German unification and the transformation of the East German economy as well as formal agreements between the actors to establish information and consultation rights. The links in the latter were determined by asking representatives of the organizations to name up to six other actors whose interests, goals, decisions, or expectations where taken into account in the decision making of their own bodies/organizations.
This document was generated on 24 Aug 2001 using the LaTeX2HTML translator Version 98.1p1 release (March 2nd, 1998) and manual post-processing. Copyright ® 1993, 1994, 1995, 1996, 1997, Nikos Drakos, Computer Based Learning Unit, University of Leeds.
Copyright ® 2001, Journal of Social Structure