BibSonomy Anatomy
Katy Bornera and Nianli Maba Professor at
bSenior Systems Analyst, Indiana University
Bibsonomy Anatomy
The
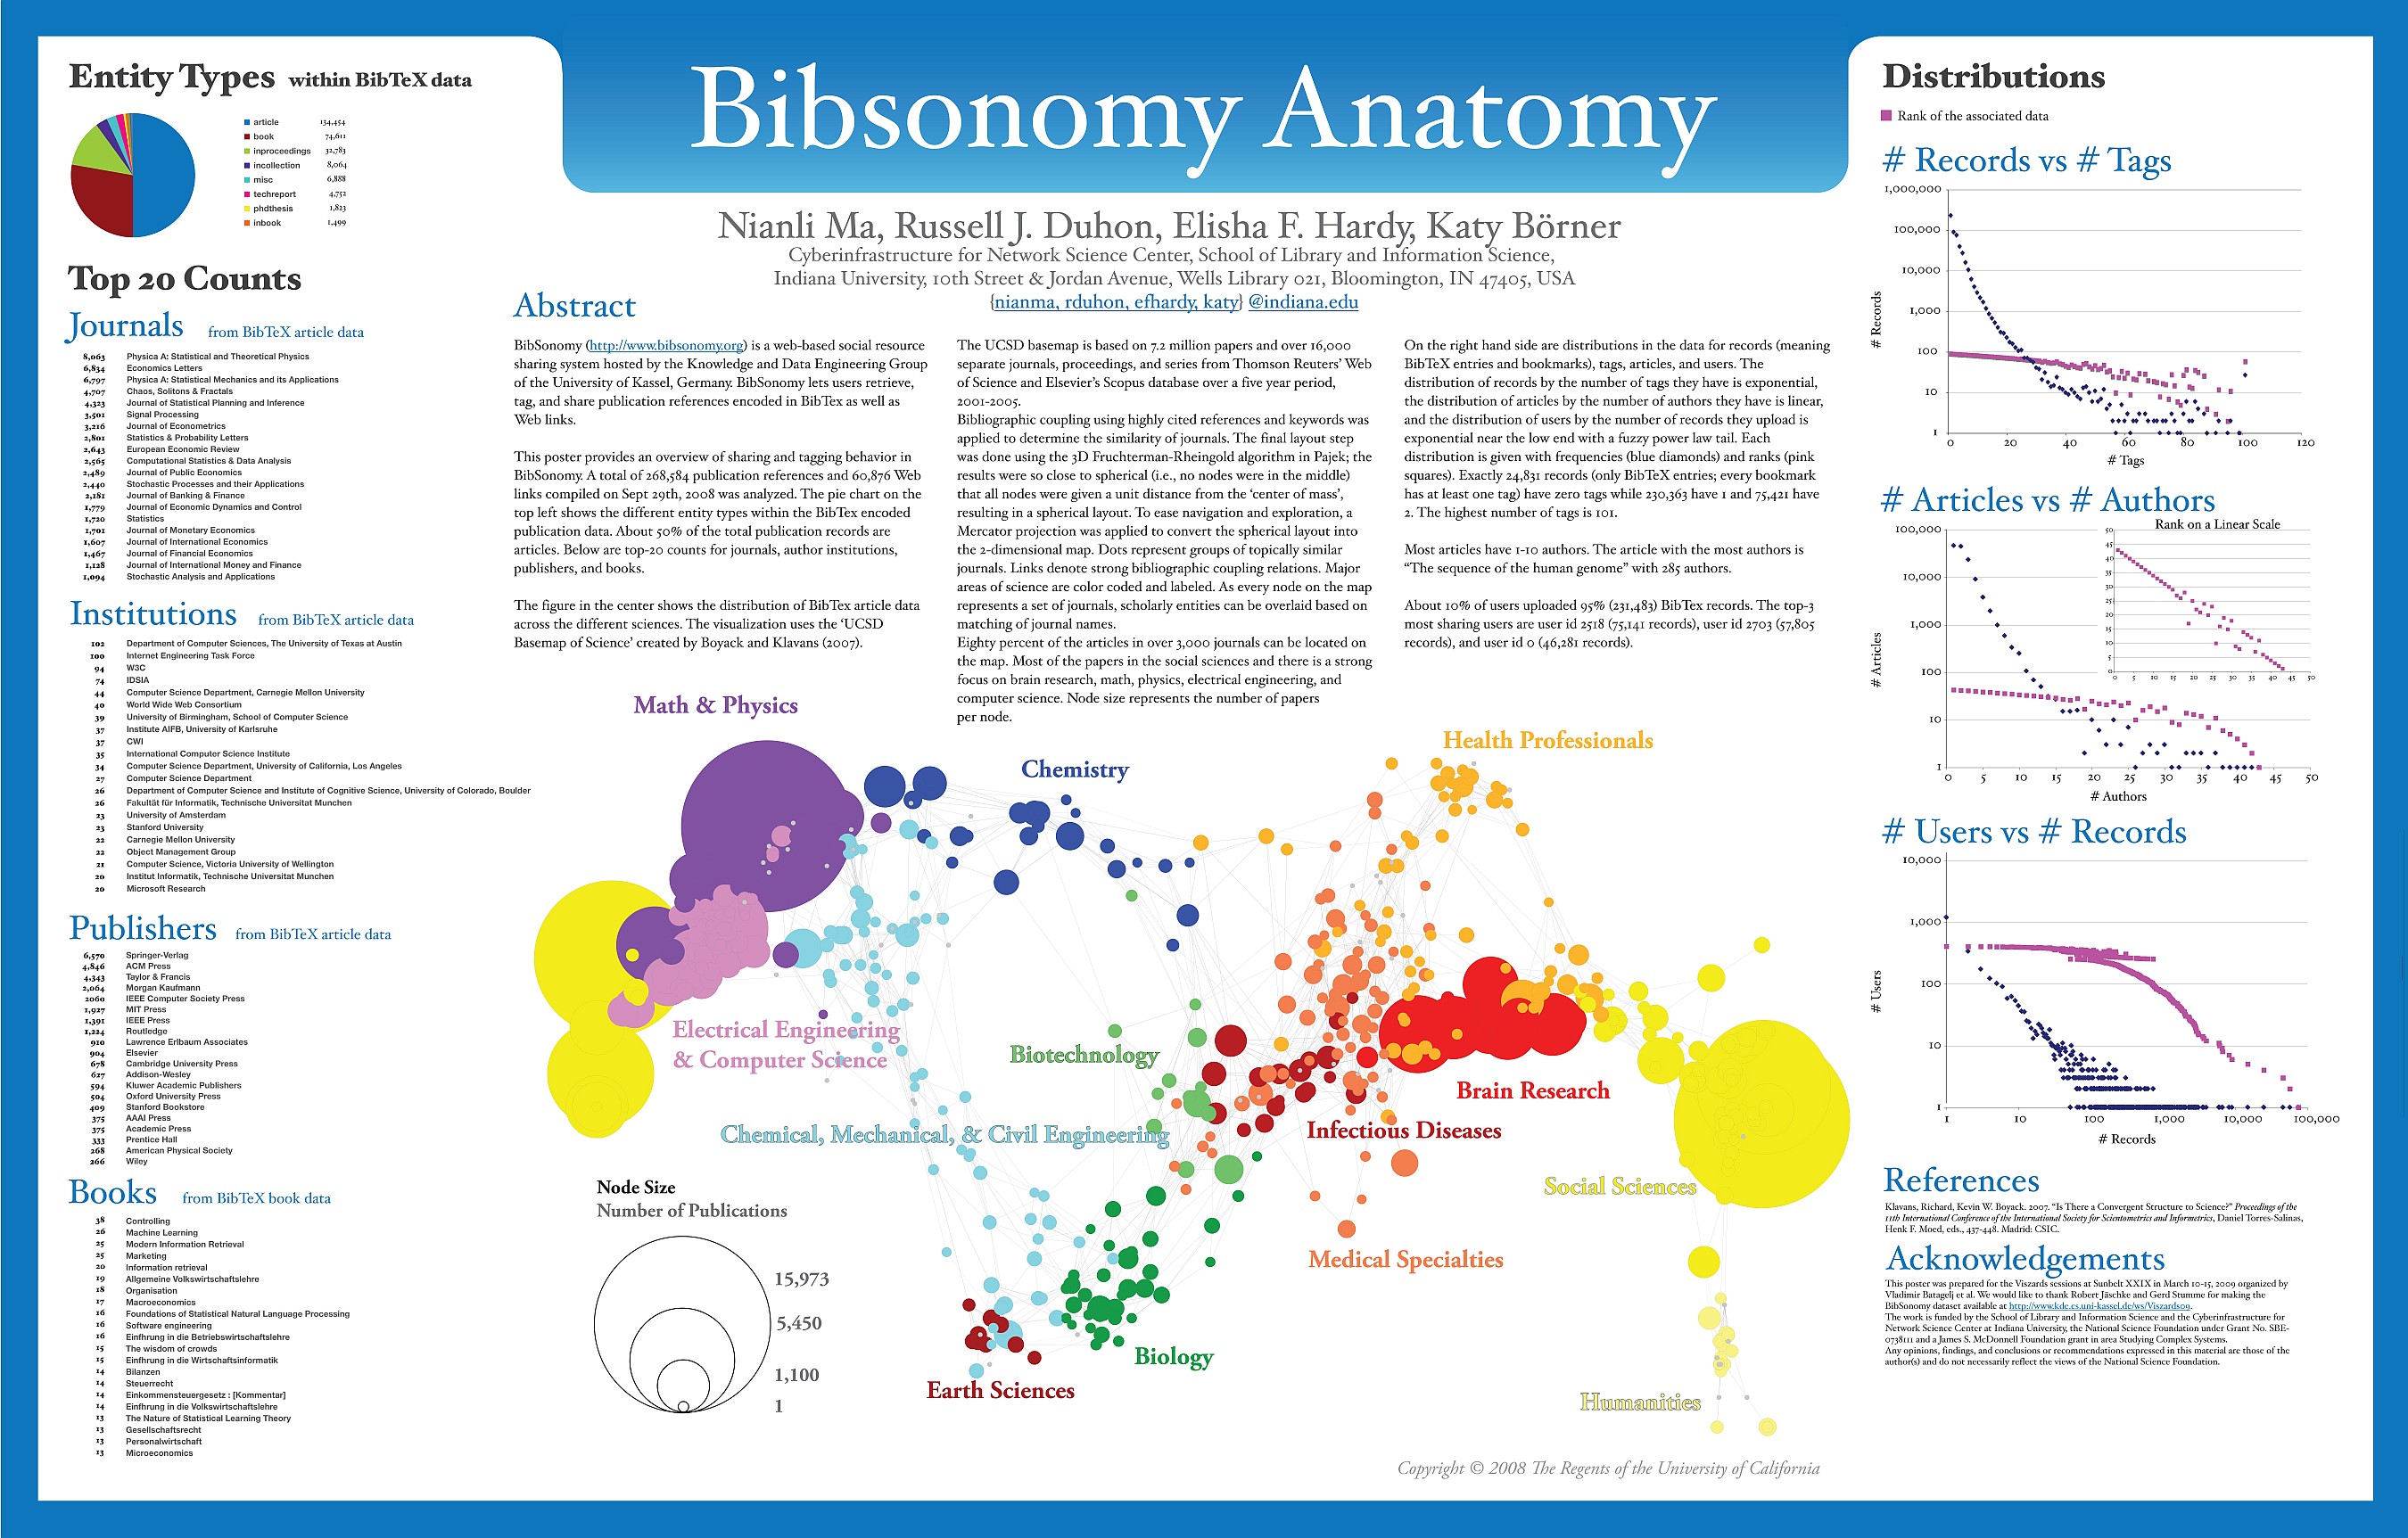
analysis presented here provides an overview of sharing and tagging behavior in
BibSonomy using a total of 268,584 publication references and 60,876 Web links
compiled on Sept 29th 2008. BibSonomy (http://www.bibsonomy.org)
is a web-based social resource sharing system hosted by the Knowledge and Data
Engineering Group of
The pie chart on the top left shows the different entity types within the BibTex entries. About 50% of the total BibTex entries are articles. Below are top-20 counts for journals, author institutions, publishers, and books.
The figure in the center presents the distribution of BibTex article data across the different sciences. The visualization uses the ‘UCSD Basemap of Science’ created by Boyack and Klavans (2007) based on 7.2 million papers and over 16,000 separate journals, proceedings, and series from Thomson Reuters’ Web of Science and Elsevier’s Scopus database over year 2001 to 2005. Eighty percent of the BibTex articles in over 3,000 journals can be located on the UCSD Basemap of Science. Most of the papers are in the social sciences and there is a strong focus on brain research, math, physics, electrical engineering, and computer science. Node size represents the number of papers per node. On the right hand side are distributions in the data for records (meaning BibTex entries and bookmarks), tags, articles, and users.
PEER REVIEW COMMENT No. 1
The authors offer a visualization layout which summarizes a vast amount of information about the bibliographic connections across disciplines. The figure shows, in a snapshot, how different disciplines connect to the rest of the science world: for example, the social sciences are linked to the health professionals who, in turn, are connected to some of the natural sciences. This visualization offers an attractive color and layout scheme, cleanly summarizing a large network; it does not, however, tell a clear single story, and the viewer is left a little puzzled as to the point. In that sense, it is truly more akin to a map rather than a typical analytic graphic.
PEER REVIEW COMMENT No. 2
The authors have summarized a tremendous amount of information into a single visualization, that nicely differentiates fields of knowledge. The visualization makes good use of color but the distinction between edge strengths connecting the nodes is rather weak. The image does a nice job of quantifying the visualization with the scaled node size and distributions. The layout – based on a 2-d projection of a spherical layout, is very clever. But it is also not immediately clear to viewers. I wonder if it would be useful to include a “globe” inset or similar. This is largely a reader context issue – we’re used to seeing 2-d projections of the earth map and these are untroubling (for users, anyway), since we know the underlying 3-d distruibution. Here, the closeness of the right/left “ends” of the map may be misinterpreted as further from each other than the data show.
PEER REVIEW COMMENT No. 3
This submission leverages the Mercator projection into a very inventive solution to odd layout results. It preserves the layout's effective demonstration of the gradual way in which related disciplines blend into each other, but presents that layout in a more engaging way. I wonder if the blending remains as clear without the journal grouping – are we seeing latent structure revealed in the central tendency of journal groups, or is this a function of niche differentiation among journals that cater to a similar audience?