Ties within and between the 6 regularly equivalent positions in the trade of agricultural products
Carl NordlundTies Within and Between the 6
Regularly Equivalent Positions in the Trade of Agricultural Products
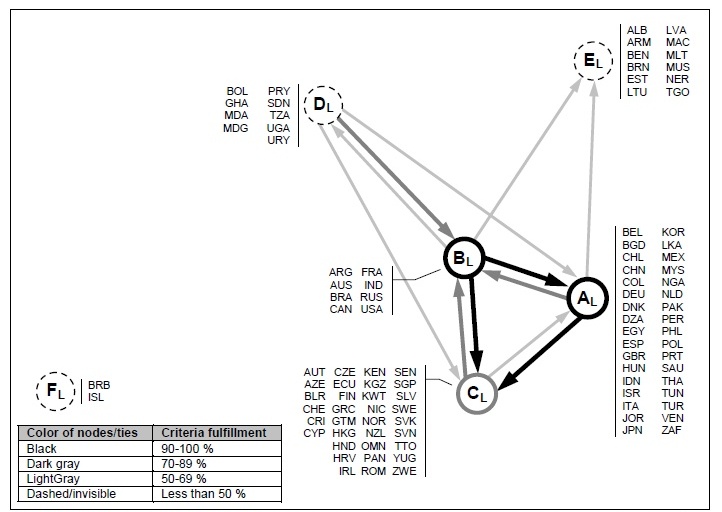
Figure 8.11: Ties within and between the 6 regularly equivalent positions (applying
criteria fulfillment formula 1 with a relative cutoff value of ~0.0102 (1/98)).
Self-Commentary
The diagram
above is a structural map of international flows of agricultural hectares (aka
‘ecological footprints’) between 1995-99. Countries are categorized according
to their sharing of similar regular roles in the trade of agricultural
products. Positions are determined using multi-dimensional scaling on the
matrix containing REGE coefficients, whereas arrows indicate regular ties
depicted using a criteria-fulfillment heuristic developed for datasets with
huge value spans (Nordlund 2007).
Ties within and Between 8 Regularly Equivalent
Positions
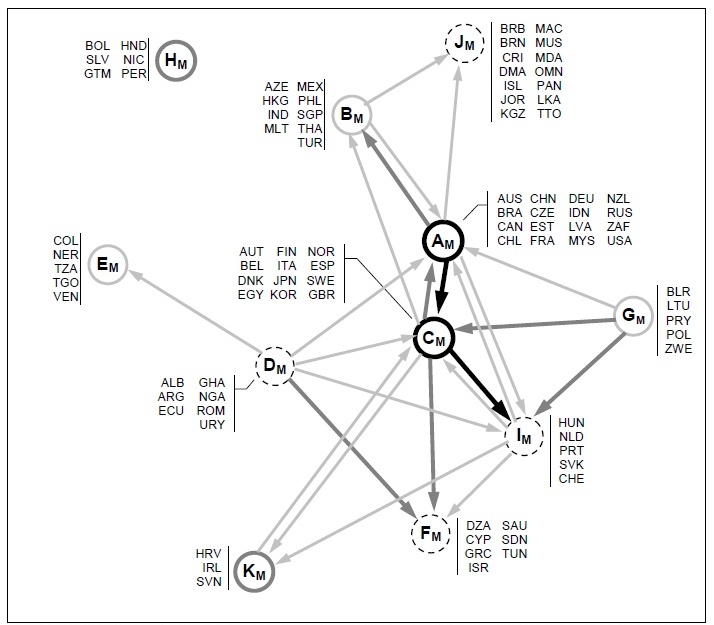
Figure 9.8:
Ties within and between the 8 regularly equivalent positions: forestry
commodity biomass flows (applying criteria fulfillment formula 1 with a
relative cutoff value of ~0.0112 (1/89)).
Similar to the first diagram, the above second figure
is a structural map of international flows of timber biomass during the 1995-99
period. Determining role-equivalence through the REGE algorithm, the resulting
structural map depicts a structure where a dual core controls the network of
forestry product trade.
Both diagrams are taken from Ecography; International trade, network analysis, and ecological
conceptualizations of unequal exchange – my PhD thesis in human ecology (
PEER REVIEW COMMENT No. 1
The visualization above depicts the international flows of
agricultural and forestry products. The vast web of trade is simplified by
placing countries in regular equivalent roles and mapping the relations across
the roles. It is clear from the second graph that the forestry trade
network exhibits a dual core structure, where two sets of regularly equivalent
countries are at the core of the network. The regular equivalence graph nicely
simplifies a very complicated network.
The image itself is difficult to use in stand-alone form, since too much
is assumed of the viewer. It is not clear, for example, what the "criteria
fulfillment" actually is and why it is important, so some simple
explanatory work there might be helpful.
PEER REVIEW COMMENT No.
2
This visualization is a depiction of the role structure of an international trade network. While this image provides an excellent concentration of a large amount of information, it is lacking a clear interpretation. As a model of the world system, it would help if there were a simple way to compare the two contents of trade represented in the two figures. I find myself comparing the country codes of the two cores, to see who is left out in each.
PEER REVIEW COMMENT
No. 3
This
submission provides a great structural view of the data, without obscuring the
identities of individual nodes. I wonder
if the node identities can be arrayed to provide additional information,
without detracting from the structural clarity provided in an REGE-based
diagram.