Dollars or Links? How Would you Organize your Portfolio of Projects – by Project Costs, or by Project Interdependencies?
Graham Durant-LawKnowledge Matters, Principal and Director
Dollars or Links?
Caption
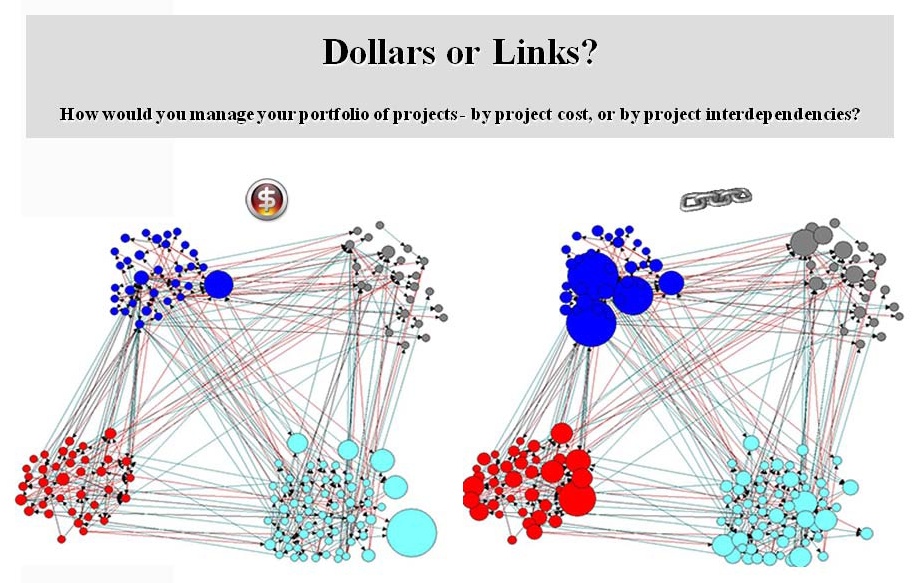
Complexity in a
portfolio of projects can be viewed in many ways. In the exhibit the same
network of projects is shown as two graphs. The nodes are projects coloured and
grouped by business unit. Each business unit runs a discrete program of similar
projects, and the four programs make up the portfolio of projects. The links
represent an inter-project dependency of some sort, and are coloured by the
importance of that dependency: red lines representing a critical dependency.
In the graph on the
left the nodes are sized by the estimated final acquisition cost of the
project. The large light-blue project at the bottom of the graph is obviously
the project with the biggest budget. This “dollars view” of the business suggests that the
bulk of effort should be directed to the light-blue business unit, and this is
in fact how the organization works and allocates its resources.
In the graph on the right the projects are in the same relative position
and use the same colour-codes.
This time however they are sized by the number of incoming links
(in-degree). A project that links to another project is reliant on that project
to deliver part of its capability. Note the dramatic change in size of the
projects when viewed this way. Also note how the light-blue business unit
decreases in importance, relative to the other business units.
A couple of other
observations are worth noting. The “dollars
view” of the world is well understood in the organization
– that is the program managers all know what the budgets of the projects are.
The “link view” is not well understood at all. Few
project officers see the linkages beyond the links to and from their project.
Program managers tend to look inwards unless there is a “big-dollars” project in another business unit that directly
impacts on them. No-one has a complete understanding of the inter-project
linkages. The graphic is a visualization of collective knowledge, and is
powerful because it has the potential to generate a paradigm shift in how the
portfolio of projects is managed. In this case the visualisations caused some
resources to be redistributed from the light-blue business unit to the other
programs.
Self-Commentary
The exhibit is from
an almost complete doctorate entitled “Visualising
Collective Knowledge to
Manage Complexity in a Portfolio of Projects”. It
uses data collected in a defence industry organisation in
2007. The organisation in question directly manages just over 200
projects and monitors a further 200 or so, with a portfolio value exceeding $50
billion in total. For something to be considered as a project the acquisition costs
must exceed $20 million – anything less is considered to be a ‘minor’. Each
node therefore represents at least $20 million, and some nodes are as large as
$3 billion.
The organisation
was envisaged as a system of networks. Depending on how the networks were
viewed, the nodes were individuals, projects, project teams, business units, as
well as business functions, policies or documents. In this graphic the nodes
are projects grouped by business unit.
Data were collected
using two methods. First a desk top scan of portfolio and project documentation
was used to identify known dependencies, and to collect initial attribute data
such as cost, business unit, delivery date, and so on. Then a semi-structured
interview technique, based around 23 main questions was used. Four questions
were of a demographic nature; twelve questions specifically dealt with project
interfaces; three addressed inter-organizational interfaces, and four focused
on internal collaboration.
At the time of data
collection the organisation’s population was 123 project officers, of which 104
were interviewed. Of the project officers that were not interviewed, five
declined to participate, five failed to attend multiple appointments, and nine
were deployed overseas. If the deployed overseas component is removed, because
they simply could not be interviewed, then the adjusted population was 114,
meaning 91% of the possible population was captured.
Answers were
recorded directly in Microsoft Excel® 2007 workbooks and afterwards imported
into a Microsoft Access® 2007 database. This later step allowed data to be
manipulated across multiple networks, and structured for subsequent export for
network analysis and visualization purposes into UCINET 6, NetDraw, or
NetMiner® 3.
The network
analysis techniques used in this research were novel to the organisation
because project officers, and program and portfolio managers, typically adopt
either a linear production task-driven approach, or a functional
information-processing approach. Both these methods have their place and their
utility; however a network relationship approach adds to the manager’s armoury,
and offers a means to effectively manage, decompose, and understand program and
portfolio complexity. It is a particularly good method to answer questions
like: “How do we keep track of all the interdependencies?”, “How do we share understanding and agree on what we have to do?”, and “How can we be in a position to anticipate, control or
take advantage of changes, given they can occur
at any time?”
PEER REVIEW COMMENT
No. 1
"Dollars or Links" uses a deliberately constrained layout to compare the relative importance of particular organizational projects under two different criteria, captured in the node sizes. The visualization clearly shows that projects with a high cost are not necessarily, and often are not, the projects which are critical for the completion of a high number of other projects. The figure nicely juxtaposes two networks to show a point. Unfortunately, the only thing that changes across networks is node size, and it is not clear how the network structure or color scheme contribute to the information of the image. It might be useful to use the colors as distinct from the positions; and allow the network structure to determine placement?
PEER REVIEW COMMENT
No. 2
The visualization juxtaposes two ways of thinking about the importance of projects. The first is its dollar value, and the second is the extent to which it is involved with other projects. The image shows that the two need not overlap and calls into question the prominence given to high cost projects. While the image compares these two perspectives well, the image itself appears cluttered, as the lines cross a great deal of otherwise empty space. It is not clear from the position of red versus blue links if there is systematic dependencies between departments, or if one department relies on another more than others, so I wonder if there would be a way to summarize that information in width of links or placement?
PEER REVIEW COMMENT
No. 3
This
visualization provides clear visual back-up for its main thrust – acquisition value belies the extent to which
each node depends on others. It is
elegant in its practical grounding. I
would be curious to see a hybrid network – can both acquisition value and node
assistance value be combined to better represent the reality of each node
within the organizational structure?