
The Physicist’s Guide to the Universe
by Jocelyn Duffy
Just as early cartographers struggled to map the terrain of undiscovered lands on Earth, modern day cosmologists face a similar challenge as they try to map the universe—something they can’t physically explore. While the invention of tools like the sextant and compass helped terrestrial mapmakers, new technologies like the latest generation telescopes and the largest supercomputers are allowing cosmologists to map the far reaches of space without leaving the comforts of Earth.
The light that is given off by galaxies, quasars, supernovas and stars help cosmologists draw maps of the visible universe. How that light behaves in space also gives researchers clues to understanding what is happening in the vast areas that are dark. In fact, most of the universe—96 percent of it—is made of dark energy and dark matter that can’t be seen directly.
Mapping the universe, both the visible and invisible parts, is a huge undertaking. No one university, let alone one person, could map the universe. Large collaborations that often involve researchers from laboratories and universities around the world are key to creating detailed cosmological maps.
“In general, there are things that can’t be done with one or two people working alone. When you want to answer a question as big as ‘what is the universe made of?’ you need these large collaborations,” said physicist Rupert Croft. “The future of cosmology is doing these large surveys of the universe. The strengths of CMU, things like theory, observation, computer science and statistics, are well oriented to this type of astrophysics.”
Carnegie Mellon University’s Bruce and Astrid McWilliams Center for Cosmology has been growing to meet these challenges. Since its inception in 2008, the center has hired Assistant Professors Shirley Ho, Rachel Mandelbaum and Hy Trac, three of the most promising young cosmologists in the field, to complement the work of the center’s other high-profile faculty, including Associate Professors Croft and Tiziana Di Matteo and Professor Jeffrey Peterson. The center also has recruited a number of skilled graduate students and postdoctoral researchers. These scientists are taking leading roles in multiple prominent international cosmology collaborations, including the Sloan Digital Sky Survey III (SDSS-III), the Large Synoptic Survey Telescope (LSST), the Giant MetreWave Radio Telescope, the Hyper Suprime-Cam (HSC) survey and the Atacama Cosmology Telescope (ACT).
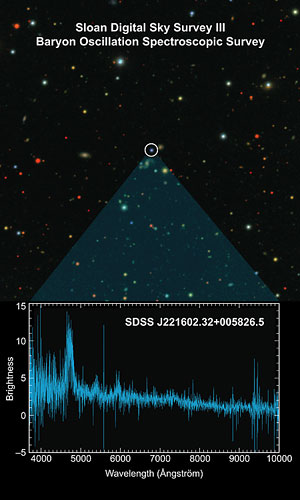
The Baryon Oscillation Spectroscopic Survey (BOSS) targets individual objects in space, like the blue quasar (above), and collects spectrographic data (below). From this wavelength data, researchers are able to calculate the distance to the object and map the geometry of the universe. Image: D. Hogg, V. Bhardwaj and N. Ross for the BOSS Team.
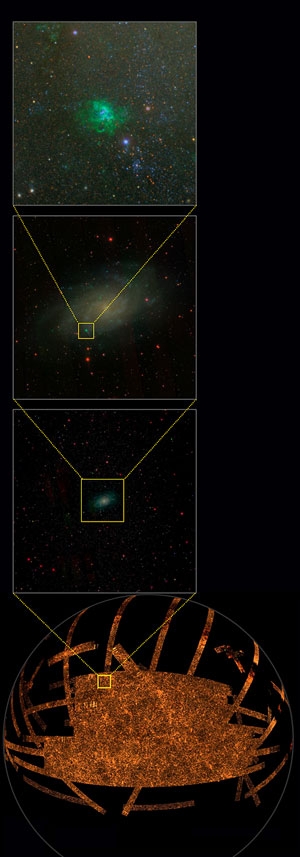
SDSS-III has created the largest-ever map of the sky. Researchers can use the map (bottom) to see the large-scale structure of the universe, or they can focus on individual galaxies, such as the Triangulum galaxy M33 (middle), or objects within a galaxy, such as the nebula NGC 604 (top). Image: M. Blanton and the SDSS-III.
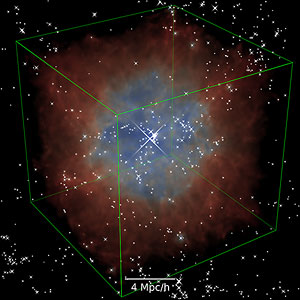
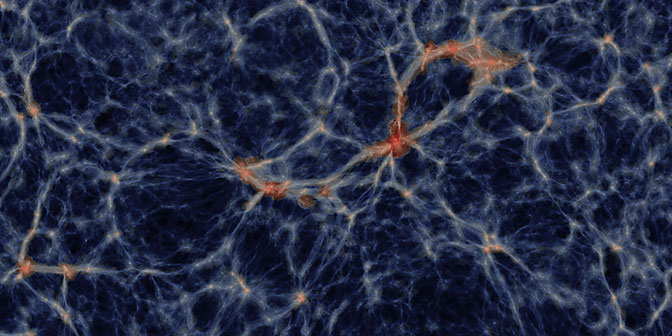
Simulations developed by the McWilliams Center allow researchers to visualize the evolution of elements within the universe. This image shows the gas that surrounds a quasar. Image: Yu Feng.
The Big Picture
Many of the McWilliams Center researchers are working on the SDSS-III, which is currently one of the premier cosmological surveys in the world. The Sloan Digital Sky Survey (SDSS) used a 2.5-meter telescope at the Apache Point Observatory in New Mexico to capture images of luminous objects in 35 percent of the night sky. From these images, SDSS-III researchers have chosen a subset of galaxies, stars and quasars to study further using a specialized spectrograph that measures the light coming from the objects as a function of wavelength. This wavelength data gives the researchers much more information about the objects than the imaging data alone.
In 2011, SDSS-III researchers used this imaging and spectroscopic data to publish the largest 3-dimensional-color map of the universe, covering about one-quarter of the sky. According to members of the survey, the map contains more than one trillion pixels—so much detail that to view it all you would need 500,000 high-definition televisions. Earlier this year a group led by Ho published the first “reading” of this map.
“We have this huge color map of the universe. What can we learn from it?” Ho said. “We chose to look at the power spectrum, which tells us how the amount of matter varies within one patch of the sky.”
Ho’s group took 900,000 luminous red galaxies observed through the SDSS-III’s Baryon Oscillation Spectrographic Survey (BOSS), and measured the galaxies’ brightness in five different colors. Using this data, Ho was able to calculate what’s called the power spectrum of the universe—a representation of how the density of matter varies throughout the universe. In the power spectrum lies information about baryon acoustic oscillations (BAOs), relics of sound waves from the very early universe. These sound waves have left their mark on the large-scale distribution of matter in the universe. By measuring the relics of these early sound waves, researchers can use them as a kind of standard cosmological ruler and precisely calculate how the universe has expanded over time.
“You can also derive how fast the universe is expanding and you can derive how much of the things that are really hard to find—like dark energy and dark matter—there is in the universe,” Ho said.
BAOs are just one aspect of the terabytes of data produced by SDSS-III that can be used to measure the mysterious dark energy that makes up the majority of our universe and drives its accelerating rate of expansion.
Mandelbaum uses data from all three phases of SDSS to measure weak gravitational lensing. As light from far-off stars and galaxies travels towards Earth, it passes other galactic objects. The mass of these objects bends the light, resulting in distortions in the images we see. These distortions can vary in size. The large distortions and multiple images caused by strong lensing are only seen in the densest parts of the universe. Slight distortions caused by weak lensing can be seen throughout the universe by averaging over many lensed galaxies. By studying weak lensing, researchers like Mandelbaum can study how matter clumped together as the universe evolved to form the large-scale structure we observe today.
“BAOs and lensing are complementary measurements. When we measure BAOs, we’re directly measuring the expansion of the universe. When we measure lensing, we measure the clumpiness of the matter in the universe,” Mandelbaum said. “When you combine the two, you can learn a whole lot more about the evolution of the universe.”
Night Vision
While the maps created by SDSS-III rely on the light emitted from bright objects like quasars, there are vast swaths of sky that aren’t illuminated by neighboring stars. These areas are especially prevalent in the early universe where galaxies didn’t exist and stars and quasars were few and faint. Cosmological cartographers have to find ways to map what’s in these dark regions.
“Eighty-five percent of the matter in the universe is dark matter, which is hard to detect because it doesn’t give off light. The remaining 15 percent is cosmic gas, and only 10 percent of that gas forms the stars and galaxies that we can see,” Trac said, “That’s the challenge of cosmology, trying to use the one percent to tell you about the other 99 percent.”
SDSS-III is able to gather information from the relatively scant amount of gas, stars and quasars some 11 billion light years away. While the signals may be weak, cosmologists are able to get strong signals from an area of the hydrogen spectrum called the Lymanalpha line. Croft and Trac study this line to determine the exact location of invisible clouds of gas within the structure of the early universe. By partnering with statisticians, they are then able to feed this information about early gas clouds into computer simulations and use those simulations to make more accurate predictions about how the universe was structured during this time.
“When you try to reconstruct the expansion of the universe, as we are doing with SDSS-III and will do with future projects, you place constraints on dark energy. This requires us to have a complex understanding of galaxy formation that we can only get through direct cosmological simulation,” said Di Matteo, who uses her large-scale computer simulations to help researchers working on SDSS-III interpret their data.
Di Matteo, Croft and Trac make simulations that follow the distribution of matter in the universe from the Big Bang to today as it responds to things like gravity, heating and cooling, energy transfer, star formation, and the effects of supernovae and black holes. The simulations tell the researchers how quasars, galaxies, large clusters of galaxies and other structures arise in the universe and develop into the objects that are visualized by the SDSS-III.
“By simulating the dynamic evolution of objects in the early universe, we can see how they came to be and how they look in our present universe,” Di Matteo said. “Our simulations are a tool that can predict what the next generation of telescopes should see as they look back in time and what exciting breakthroughs we may expect to discover.”
As the McWilliams Center works in earnest on the projects of today, they are working equally hard to prepare for the projects of tomorrow. The center has been a member of the Large Synoptic Survey Telescope (LSST) project since 2008.
“When you start planning a survey, you have a lot of decisions to make. How best can we do the science we want to do?” Mandelbaum said. “It’s important that we put in the time now, because it means we will be able to do better science later.”
Construction on the LSST is hoped to begin in 2014. The 8.4-meter wide-field survey telescope will use a 3-billion pixel camera to survey the entire visible sky. By taking pictures every 15 seconds, the telescope will create images that can be used to map billions of galaxies and produce a movie that will allow researchers to study changing objects like exploding supernovae and near- Earth asteroids.
McWilliams Center researchers are taking on increasing leadership roles within the project. This year, Fred Gilman, director of the McWilliams Center and dean of the Mellon College of Science, was named chair of the AURA Management Council that oversees the planning and the construction of the LSST project. Ho and Mandelbaum are co-leaders of research tasks within the LSST’s Dark Energy Science Collaboration. They, along with Croft, Di Matteo and Trac, are conducting research on ways to analyze the LSST data to understand the nature of dark energy.
“From the Sloan Digital Sky Survey to the LSST, we have a path at the forefront of cosmology research for at least the next two decades,” Gilman said.
To learn more, visit The Bruce and Astrid McWilliams Center for Cosmology.