JoSS Article: Volume 11
Understanding the Composition of an Ensemble of Personal Networks
Ulrik Brandesa, Jürgen Lernerb, Miranda J. Lubbersc, Christopher McCarthyd, José Luis Molinae and Uwe Nagelf,a Professor at
b Post-Doctoral Researcher at
c Post-Doctoral Researcher at Autonomous
d Program Director at
e Professor at Autonomous
f Graduate Student at
Understanding the Composition of an Ensemble
of Personal Networks
Self-Commentary
Personal networks are often
classified either by structural indices or their composition of alters. We combine these two dimensions by
considering attribute values as positions in social space. This way, social roles can be derived via
clustering, and these in turn lead to role graphs representing the main
characteristics in comparable aggregates.
Role graphs are obtained by
contracting all alters occupying the same position in social space, and adding
weights to nodes and edges representing the support and internal density of a
role, and the density of connections between roles. An unsupervised clustering of role graphs
yields the main structural trends in the ensemble.
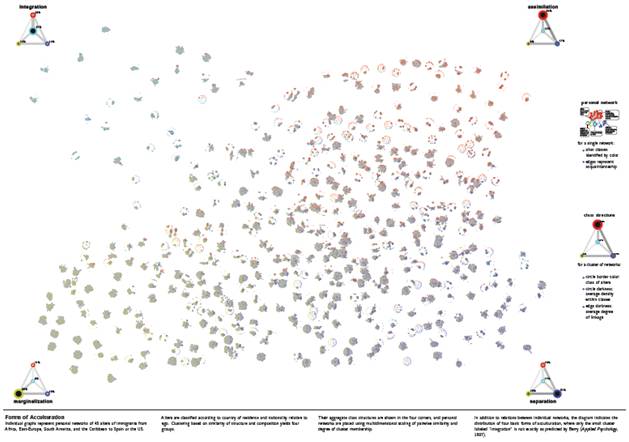
A graphical representation
is constructed in two steps: each personal network is laid out individually,
and then treated as an object that is positioned with respect to the other
objects. In the individual layouts, the
fixed layout of the 4-node role graph is used as a frame of reference, and each
alter position is biased slightly toward the position of its role. Since the clustering of role graphs cannot be
represented well in two dimensions, personal networks are positioned using a
combination of their pairwise role-graph similarity, and a bias towards the
corner in which their cluster representative is shown.
Application to an ensemble
of migrant networks composed of 45 alters each revealed four prototypical cases
that largely coincide with expectations derived from the literature. Roles are defined by country of origin
(same/different) and country of residence (same/different) with respect to
ego. Role graphs combine attribute
composition as represented in the relative size of roles, and structural
characteristics as represented by edge density inside and between roles. The overview indicates, however, that one of
the four prototypical cases (`integration') is not exactly as expected
(overrepresentation of transnationals), and has a much smaller support. The visualization can be read on different
levels, since the main finding is apparent from the overall spatial
distribution, but every detail in the data leading to it can be traced
individually.
PEER REVIEW COMMENT
No. 1
This network role graph offers a unique representation of the distribution of immigrant ego networks that nicely crosses levels of analysis. At a macro level, the visualization is organized along role types, where some ego networks are characterized by many ties to fellow immigrants while other ego networks are characterized by assimilation, where there are many ties to people of the immigration country. At the micro level, ego networks are placed in a multidimensional space, showing how close they are to ideal role types. The role graph display is a highly creative layout for an important type of data (ego networks). The image is very complex, and thus rewards multiple views and continued study, this represents a balancing connundrumm between a single summary point and detail. Nice work.
PEER REVIEW COMMENT
No. 2
The image portrays a multidimensional space of immigrant ego networks combining two crucial features: ethnic composition and density. The placement of each ego net on the display is a according to its similarity to the other ego nets surrounding it and its similarity to four prototypical ego net configurations. The use of color to indicate ethnic composition is effective at a distance however the detailed darkness around the circles and edge color denoting density gets lost (perhaps a scale/resolution issue?). Although this image conveys much detailed information, substantively would be nice to think through what is gained over a simpler representation, boiled down to the prototypes and the proportion of ego nets that are clustered with that prototype, for example .
PEER REVIEW COMMENT
No. 3
This
creatively re-imagined scatterplot effectively provides information at multiple
levels. At the macro-level, it gives us
an intuition about the distribution of ego network structures across
typologies, while at the micro-level it provides case-level insight into the
structures behind the patterns. I would
be interested to see some sort of independent variable mapped into this
visualization- what predisposes these migrants toward certain network patterns?