
Deciphering Data
Click here to view full-size infographic [.pdf] »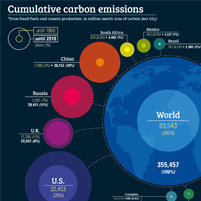
An image can be worth a 1,000 words.
Explaining science concepts can be challenging, which is why Carnegie Mellon University Ph.D candidate Ivonne Peña wants to create infographics.
Her latest shows how carbon emissions from fossil fuels and cement production have changed globally during the past 50 years.
The idea came after teaching a session on international carbon dioxide emissions for SUCCEED: The Summer Center for Climate, Energy an Environment Decision-Making, a five-day program for ninth graders. Since the 1960s global carbon emissions have quadrupled.
"I remember when we were doing that session, another student and I had a lot of trouble trying to show the best way for students to understand the difference in magnitude between countries," Peña said.
The graph, which was posted on the Energy Collective blog, illustrates historical increases and how the percentages of the emissions within countries have changed. For example, while the U.S. has nearly doubled its annual emissions since 1960, it has gone from contributing 40 percent to 27 percent of the emissions. At the same time, the United Kingdom has decreased its annual emissions and some developing countries are beginning to contribute annually as much as developed countries.
From Bogota, Colombia, Peña is a member of CMU's Center for Climate and Energy Decision Making and part of the joint program between the university's Department of Engineering and Public Policy and the Technical University of Lisbon, Portugal.
She earned a master's degree from the University of Pittsburgh before joining the CMU Portugal program.
"I thought EPP and the CMU Portugal programs were a great opportunity," Peña said. "I knew Pittsburgh but I also wanted to see other places and go to Portugal and learn about European academia were a great opportunity to decide where I might see myself after graduation."
Now in her fourth year, Peña's research focuses on wind power. She said she loves CMU interdisciplinary nature, and enjoyed learning about Europe's academic institutions.
Once she graduates, she hopes to continue to communicate information about science and policy decisions. She's still exploring the best way to do that.
"CMU is helping me be able to talk to people who are already in that interdisciplinary area," she said. "And not only to communicate to policymakers, but also to the public about what policymakers are doing. You see, the public gets a lot of misinformation and misunderstanding because you don't phrase the issues well, especially if what you need to communicate conveys multiple disciplines."
Related Links: View full-size infographic [.pdf] | Social and Decision Sciences Department | Engineering and Public Policy | The Science of Science Communication